Behaviour Analytics
Versions
Current version
v0.9.3 (2023031700)
v0.9.3
Plugin type: Blocks
Frankenstyle component name: block_behaviour
Version build number: 2023031700
Version release name: v0.9.3
Maturity: Beta
Supported Moodle versions: 3.4, 3.5, 3.6, 3.7, 3.8, 3.9, 3.10, 3.11, 4.0, 4.1
Repository URL (Git): https://github.com/VIP-Research-Group/moodle-block_behaviour
Repository branch:
Repository tag:
Issue/bug tracker URL: https://github.com/VIP-Research-Group/moodle-block_behaviour/issues
Version: 0.9.3
Tested on Moodle 4.1
Removed extra whitespace as per code checker plugin
Version: 0.9.2
Changed standard page type to base in view, position, replay, dashboard scripts.
Change the position of the node legend when configuring for 4.0.
Change the cursor offset values for node legend resizing for 3.6 and above.
Change the initial positions of the centroid comment text boxes for 4.0.
Bug fix where the graph's link force does not match slider value on configuration page.
Bug fix where the CSV output for survey questions, options, and responses was not escaping double quotes.
Bug fix where LORD graph still used after integration turned off.
Bug fix where student links not showing when viewing behaviour graph with LORD and LSA graphs.
Version: 0.9.1
Added version number to block title.
Added links for other plugins and Personalised Study Guide project web page to documentation.
Added "Publications" section to documentation.
Change node mouse over iframe timeout from 750 to 400.
Weight slider default is now 0.
Changed repository.
Version: 0.9.0
Finish survey management feature.
Added the ability to integrate with the Personalised Study Guide course format.
New feature: graph generation with Lag Sequential Analysis.
Version: 0.7.8
Added global setting to allow teacher to show student names.
Added instance setting to allow teachers to choose to show student names.
New feature: clustering dashboard with summary and iteration tables.
Start of survey management feature in dashboard.
Added 3 default surveys.
Version: 0.7.5
Added navigation menu to interfaces.
New feature: ability to select students by groups when viewing and clustering.
Version: 0.7.4
Bug fix for student role ID, using unique shortname instead of archetype.
Version: 0.7.3
Added features to delete selected clustering data.
Version: 0.7.1
Changed rand() call to mt_rand() in task class
Minor bug fix where data not being reset during replay and causing errors
Change default setting for showing student IDs, won't show by default
Version: 0.7.0
Minor bug fix where replay log results incorrect when go back and forth around iteration 0
Minor bug fix where can not drag students immediately after move slider
Minor bug fix where student centroids on top of clustering centroids after move slider
Minor bug fix where student drag message on when move slider and can not drag students
Minor bug fix where mouse hover over student centroid shows their graph when should not
Minor bug fix where cluster slider disabled when should not be
Version: 0.6.10
Updated readme documentation with LORD integration
Minor bug fix where iframe preview for removed module get 404 error
Major bug fix where removing a module after it was used in clustering produces errors during replay
Minor bug fix where student drag message says on when researcher views anothers replay
Minor bug fix where researcher could not view replay results of other users
Minor bug fix where cluster slider disabled when should not be
Version: 0.6.9
Added issues link to documentation
Minor bug fix where clustering in an empty course produces JS error
Minor bug fix where trying to update centroids when no data
Major bug fix where clustering done with LORD graphs now updates properly in background
Separate pages for graphing, configuring, and replay
Export complete dataset now exports LORD data
Version: 0.6.7
Changed version numbers to account for change in Moodle plugin directory version numbers
Minor display improvements for later versions of Moodle, LORD integration options page not showing if no LORD graph
Clustering stage and replay interface enhancements, added back admin option for LORD integration, updated documentation
Minor bug fix where cluster slider could be adjusted while playing
Minor bug fix where student id is showing instead of name when text box above centroid
Feature enhancement for LORD integration where graph appears the same as in LORD plugin
Bug fix where researcher can manipulate another user's graph when course section has no modules
Feature enhancements for LORD integration, teachers can now turn integration on/off and choose custom or system graph
Minor bug fix where exporting current logs from course with no users produced DB error
Bug fix where imported records have no associated name in the DB, so students are missing from menu
Features to use graph generated with Learning Object Relation Discovery (LORD) plugin
Work around for older Moodle versions which do not have a user/lib.php::user_get_participants() function implemented
Setting to show student names rather than sequential ids
Version: 0.6.4
Student study id feature, which can be turned off in global settings
Option to export a complete anonymized dataset
Version: 0.6.2
Initial release of the plugin which contains the basic functionality described in the program's documentation
v0.9.2 (2022072600)
v0.9.2
Plugin type: Blocks
Frankenstyle component name: block_behaviour
Version build number: 2022072600
Version release name: v0.9.2
Maturity: Beta
Supported Moodle versions: 3.4, 3.9, 3.10, 3.11, 4.0
Repository URL (Git): https://github.com/VIP-Research-Group/moodle-block_behaviour
Repository branch:
Repository tag:
Issue/bug tracker URL: https://github.com/VIP-Research-Group/moodle-block_behaviour/issues
Version: 0.9.2
Changed standard page type to base in view, position, replay, dashboard scripts.
Change the position of the node legend when configuring for 4.0.
Change the cursor offset values for node legend resizing for 3.6 and above.
Change the initial positions of the centroid comment text boxes for 4.0.
Bug fix where the graph's link force does not match slider value on configuration page.
Bug fix where the CSV output for survey questions, options, and responses was not escaping double quotes.
Bug fix where LORD graph still used after integration turned off.
Bug fix where student links not showing when viewing behaviour graph with LORD and LSA graphs.
Version: 0.9.1
Added version number to block title.
Added links for other plugins and Personalised Study Guide project web page to documentation.
Added "Publications" section to documentation.
Change node mouse over iframe timeout from 750 to 400.
Weight slider default is now 0.
Changed repository.
Version: 0.9.0
Finish survey management feature.
Added the ability to integrate with the Personalised Study Guide course format.
New feature: graph generation with Lag Sequential Analysis.
Version: 0.7.8
Added global setting to allow teacher to show student names.
Added instance setting to allow teachers to choose to show student names.
New feature: clustering dashboard with summary and iteration tables.
Start of survey management feature in dashboard.
Added 3 default surveys.
Version: 0.7.5
Added navigation menu to interfaces.
New feature: ability to select students by groups when viewing and clustering.
Version: 0.7.4
Bug fix for student role ID, using unique shortname instead of archetype.
Version: 0.7.3
Added features to delete selected clustering data.
Version: 0.7.1
Changed rand() call to mt_rand() in task class
Minor bug fix where data not being reset during replay and causing errors
Change default setting for showing student IDs, won't show by default
Version: 0.7.0
Minor bug fix where replay log results incorrect when go back and forth around iteration 0
Minor bug fix where can not drag students immediately after move slider
Minor bug fix where student centroids on top of clustering centroids after move slider
Minor bug fix where student drag message on when move slider and can not drag students
Minor bug fix where mouse hover over student centroid shows their graph when should not
Minor bug fix where cluster slider disabled when should not be
Version: 0.6.10
Updated readme documentation with LORD integration
Minor bug fix where iframe preview for removed module get 404 error
Major bug fix where removing a module after it was used in clustering produces errors during replay
Minor bug fix where student drag message says on when researcher views anothers replay
Minor bug fix where researcher could not view replay results of other users
Minor bug fix where cluster slider disabled when should not be
Version: 0.6.9
Added issues link to documentation
Minor bug fix where clustering in an empty course produces JS error
Minor bug fix where trying to update centroids when no data
Major bug fix where clustering done with LORD graphs now updates properly in background
Separate pages for graphing, configuring, and replay
Export complete dataset now exports LORD data
Version: 0.6.7
Changed version numbers to account for change in Moodle plugin directory version numbers
Minor display improvements for later versions of Moodle, LORD integration options page not showing if no LORD graph
Clustering stage and replay interface enhancements, added back admin option for LORD integration, updated documentation
Minor bug fix where cluster slider could be adjusted while playing
Minor bug fix where student id is showing instead of name when text box above centroid
Feature enhancement for LORD integration where graph appears the same as in LORD plugin
Bug fix where researcher can manipulate another user's graph when course section has no modules
Feature enhancements for LORD integration, teachers can now turn integration on/off and choose custom or system graph
Minor bug fix where exporting current logs from course with no users produced DB error
Bug fix where imported records have no associated name in the DB, so students are missing from menu
Features to use graph generated with Learning Object Relation Discovery (LORD) plugin
Work around for older Moodle versions which do not have a user/lib.php::user_get_participants() function implemented
Setting to show student names rather than sequential ids
Version: 0.6.4
Student study id feature, which can be turned off in global settings
Option to export a complete anonymized dataset
Version: 0.6.2
Initial release of the plugin which contains the basic functionality described in the program's documentation
v0.9.1 (2022061200)
v0.9.1
Plugin type: Blocks
Frankenstyle component name: block_behaviour
Version build number: 2022061200
Version release name: v0.9.1
Maturity: Beta
Supported Moodle versions: 3.4, 3.9, 3.10, 3.11
Repository URL (Git): https://github.com/VIP-Research-Group/moodle-block_behaviour
Repository branch:
Repository tag:
Issue/bug tracker URL: https://github.com/VIP-Research-Group/moodle-block_behaviour/issues
Version: 0.9.1
Added version number to block title.
Added links for other plugins and Personalised Study Guide project webpage to documentation.
Added "Publications" section to documentation.
Change node mouse over iframe timeout from 750 to 400.
Weight slider default is now 0.
Changed repository.
Version: 0.9.0
Finish survey management feature.
Added the ability to integrate with the Personalised Study Guide coure format.
New feature: graph generation with Lag Sequential Analysis.
Version: 0.7.8
Added global setting to allow teacher to show student names.
Added instance setting to allow teachers to choose to show student names.
New feature: clustering dashboard with summary and iteration tables.
Start of survey management feature in dashboard.
Added 3 default surveys.
Version: 0.7.5
Added navigation menu to interfaces.
New feature: ability to select students by groups when viewing and clustering.
Version: 0.7.4
Bug fix for student role ID, using unique shortname instead of archetype.
Version: 0.7.3
Added features to delete selected clustering data.
Version: 0.7.1
Changed rand() call to mt_rand() in task class
Minor bug fix where data not being reset during replay and causing errors
Change default setting for showing student IDs, won't show by default
Version: 0.7.0
Minor bug fix where replay log results incorrect when go back and forth around iteration 0
Minor bug fix where can not drag students immediately after move slider
Minor bug fix where student centroids on top of clustering centroids after move slider
Minor bug fix where student drag message on when move slider and can not drag students
Minor bug fix where mouse hover over student centroid shows their graph when should not
Minor bug fix where cluster slider disabled when should not be
Version: 0.6.10
Updated readme documentation with LORD integration
Minor bug fix where iframe preview for removed module get 404 error
Major bug fix where removing a module after it was used in clustering produces errors during replay
Minor bug fix where student drag message says on when researcher views anothers replay
Minor bug fix where researcher could not view replay results of other users
Minor bug fix where cluster slider disabled when should not be
Version: 0.6.9
Added issues link to documentation
Minor bug fix where clustering in an empty course produces JS error
Minor bug fix where trying to update centroids when no data
Major bug fix where clustering done with LORD graphs now updates properly in background
Separate pages for graphing, configuring, and replay
Export complete dataset now exports LORD data
Version: 0.6.7
Changed version numbers to account for change in Moodle plugin directory version numbers
Minor display improvements for later versions of Moodle, LORD integration options page not showing if no LORD graph
Clustering stage and replay interface enhancements, added back admin option for LORD integration, updated documentation
Minor bug fix where cluster slider could be adjusted while playing
Minor bug fix where student id is showing instead of name when text box above centroid
Feature enhancement for LORD integration where graph appears the same as in LORD plugin
Bug fix where researcher can manipulate another user's graph when course section has no modules
Feature enhancements for LORD integration, teachers can now turn integration on/off and choose custom or system graph
Minor bug fix where exporting current logs from course with no users produced DB error
Bug fix where imported records have no associated name in the DB, so students are missing from menu
Features to use graph generated with Learning Object Relation Discovery (LORD) plugin
Work around for older Moodle versions which do not have a user/lib.php::user_get_participants() function implemented
Setting to show student names rather than sequential ids
Version: 0.6.4
Student study id feature, which can be turned off in global settings
Option to export a complete anonymized dataset
Version: 0.6.2
Initial release of the plugin which contains the basic functionality described in the program's documentation
v0.9.0 (2022030800)
v0.9.0
Plugin type: Blocks
Frankenstyle component name: block_behaviour
Version build number: 2022030800
Version release name: v0.9.0
Maturity: Beta
Supported Moodle versions: 3.4, 3.9, 3.10, 3.11
Repository URL (Git): https://github.com/Behaviour-Analytics/moodle-block_behaviour
Repository branch: master
Repository tag:
Issue/bug tracker URL: https://github.com/VIP-Research-Group/moodle-block_behaviour/issues
moodle-block_behaviour

This release has a completed dashboard, which includes a survey management console. There are 3 surveys included, which are the Felder and Solomon Index of Learning Styles, Big Five Inventory, and a System Usability Scale. This release also includes the ability to integrate with the soon to be released Personalised Study Guide course format plugin (https://github.com/Behaviour-Analytics/moodle-format_psg). There is also a new graph generation feature that uses Lag Sequential Analysis of student log data to determine the graph link strengths and node positions.
Short description:
Behaviour Analytics is a Moodle block plugin that is intended for extracting
sequential behaviour patterns of students from course access logs.
Long description:
Behaviour Analytics considers all the activities on a course page as nodes in a
graph. The links between nodes are the student accesses of those activities.
Each student then has a centroid point derived from their accesses to activities
and the coordinates of the nodes. The student centroids can be clustered to
group students and find common access patterns. The nodes of the graph can be
manually positioned and/or removed from the graph, which will affect the student
centroids. When students create new data for the system, the clustering results
get updated and can be replayed to visually verify the grouping remains correct
with the addition of the new data. Incorrect groupings can be manually altered.
The plugin is intended for teacher use and may not be seen by students.
Installation:
Behaviour Analytics can be installed directly from the Moodle plugin directory
by navigating to Site administration -> Plugins -> Install plugins and searching
for Behaviour Analytics. It can also be installed from a downloaded zip file or
by copying the plugin files into the blocks/behaviour directory.
Post-installation set-up:
The plugin contains some global settings that affect what a user sees when they
use the program. There is an option to allow students to see their study ID and
to show student names instead of sequential numbers in the interfaces. If the
LORD block is installed, then there is also the option to allow integration with
it. The settings also give the option to grant or revoke the role of
researcher to any non-student user enroled in a course the plugin is installed
in. The researcher role allows the user to see the current graph configurations
and clustering results of other users in that course. The researcher can only
see another user's data, they can not change it. The settings can be accessed
as administrator from Site administration -> Plugins overview, then searching
for "Behaviour Analytics" and clicking the associated settings link.
The block also has a scheduled task that is, by default, set to run once a day.
The frequency that the task runs can be changed by going to
Site administration -> Server -> Scheduled tasks, then clicking the settings
icon for "Update Behaviour Analytics."
Usage:
With the block installed in a course, teachers and other non-student users will
be able to see and use the program. The block contains 3 links which are used to
view the graph and run clustering, position the course resource nodes, or replay
clustering results. These links are shown to anyone who can view the block. Site
administrators will also see forms for importing and exporting logs.
Configuring resource nodes:
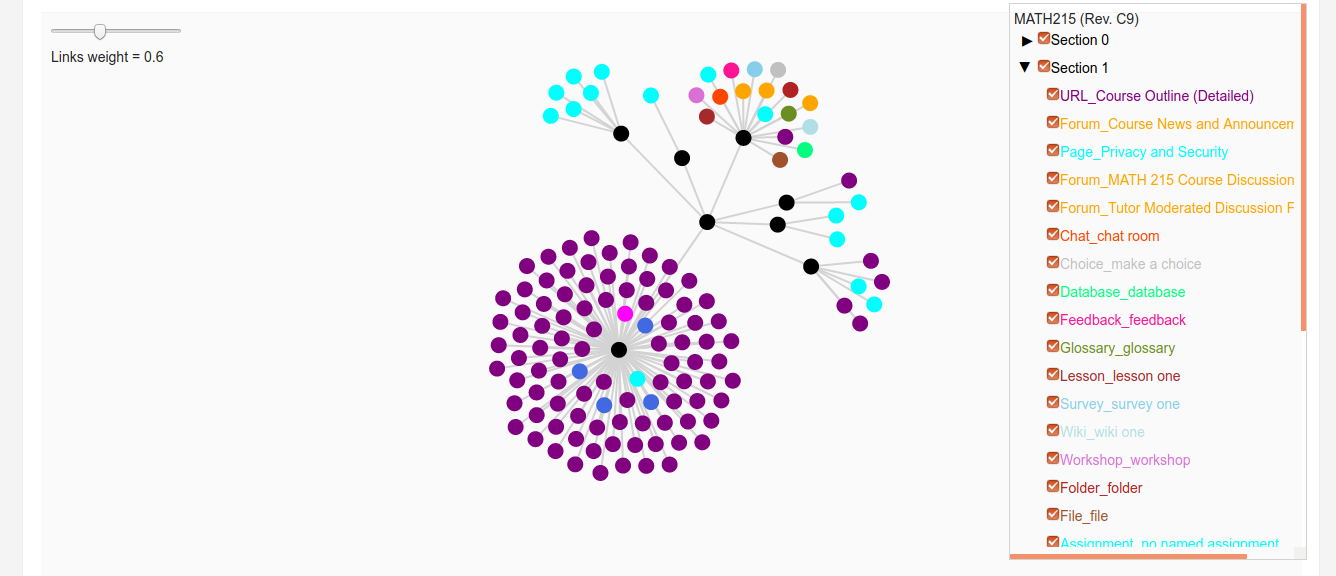
The first step is to position the resource nodes. If this is not done prior to
viewing the graph, the nodes are given automatic positions. Clicking the link
to configure resource nodes brings up the interface, which includes the graph
of all course activities, a weight slider, and a hiearchical legend of the
nodes. Researchers will also have a menu of the other user's graph
configurations.
The weight slider controls the link weights where positive values produce nodes
that pull together and the negative value will push the nodes apart. A value of
zero causes all the nodes to remain stationary. The nodes can then be dragged
into position. Unwanted nodes can be removed by right clicking and choosing the
remove option or by unchecking the associated box in the hieararchical menu.
Hovering over a node will show the type and name of the activity as well as
bring up an interactive preview. Moving the mouse away will make the name and
preview disappear.
Viewing the graph:
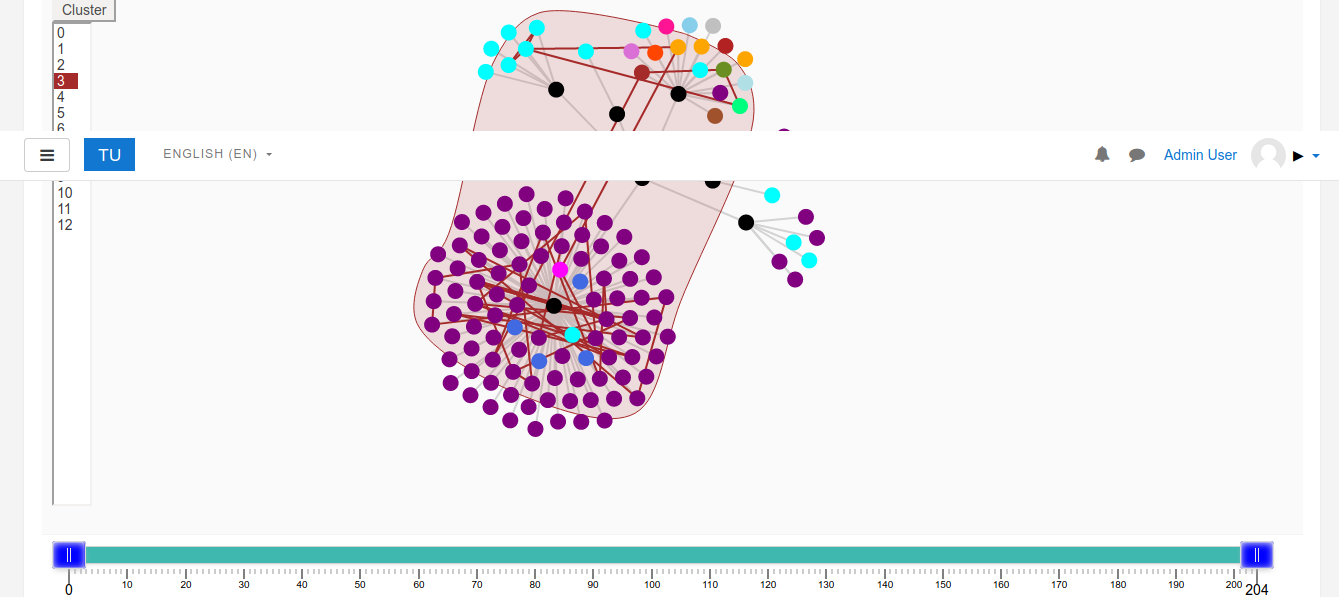
With the nodes positioned, the graph can be viewed by clicking the link to view
the graph. This interface consists of the graph, a menu of students, and a time
slider. The student menu allows selection of which students behaviour to view on
the graph. The time slider allows selection of which links to view. All users
have their time start at access 1, so not all students will have links at the
far end of the time slider. The two handles control the slice of time that is
viewed. As in the positioning stage, hovering over a node will produce the name
and a preview of the activity.
Clustering students:
There is a button labeled "Cluster" above the student menu that moves from the
graph viewing stage to the clustering stage. Clicking the button will show the
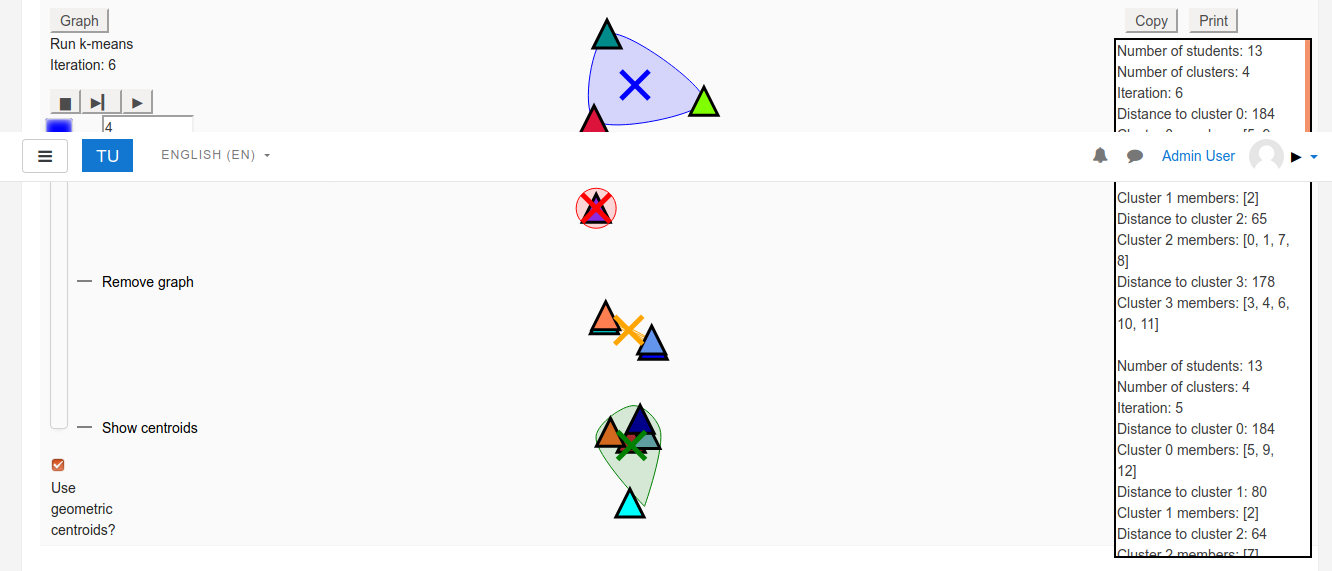
same graph and student links, but with each student centroid denoted by a
triangle. There is a radio button to choose between the default weighted
geometric centroids or decomposed centroids. The slider controls the
stages of clustering. Moving the slider to the second position removes the
graph and scales the student centroids to the edge of the viewing area. The
third position on the slider allows clustering to be performed. A text box takes
the number of clusters to use or the default of 3 will be used. The clustering
can then be stepped through one iteration at a time or it can be played to
convergence by using the associated play and step buttons. The reset button will
reset the clustering stage. All the clustering results are logged in the right
side panel, which shows which cluster each student belongs to.
During clustering, student centroids and clustering centroids can have comments
added to them. Clicking a centroid will bring up a comment box to record any
notes about the cluster or its members. Hovering over a student centroid will
show that student's behaviour graph. Hovering over a clustering centroid will
show a graph of common links among members of that cluster. Unlike the student
graph, the common links graph will remain visible until the mouse is clicked
outside the graph. While the common links graph is visible, hovering over a node
will produce a preview of that node. Hovering over a link will produce previews
of both nodes attached to that link.
During clustering, it is also possible to assist the clustering algorithm by
dragging and dropping student centroids. When a student centroid is dragged away
from its original location and dropped elsewhere, the clustering centroid
closest to where the student was dropped will have that student included in the
cluster. This feature can assist the clustering algorithm when its results are
not quite what is desired based on the user's perception of the visualization.
The clustering algorithm will still need to run again and may override the
manual clustering at this point.
Replaying clustering:
With clustering results made, the replay feature can be used by clicking the
link for replaying. A user will see a menu of each clustering run they have done
which are labeled by user id, graph configuration number, and clustering run
number. Selecting an item from the menu will bring up the same graph shown at
the onset of clustering. The play and step buttons control the replay and
determine which iteration is seen. The replay can be stepped through forward or
back, but can only be played forward. Clicking a centroid will allow notes to
be added or viewed if any comment was made for that centroid during clustering.
When a clustering run has used the full time slice of the time slider and also
run to convergence, that clustering run will be updated with new student data
when it is available. This updating will change student centroids, add
iterations to the replay, and can alter the cluster membership. Using decomposed
centroids causes the centroid to align on a node and can make the student
centroid highly mobile. Geometric centroids tend to move less as there is more
data.
Manual clustering is possible during the replay, but behaves slightly
differently than initial clustering. Once the replay has reached initial
convergence, student centroids can be dragged and dropped to place them in
another cluster. The manual clustering produces a second set of clustering
centroids that are the same colour as the originals. The original set is
unchanged while the manual clusters are more transparent and represent the
changes the user has made. Both sets of clusters are updated with new data as
it is available.
Integrating with the Learning Object Relation Discovery (LORD) block:
First, the LORD plugin must be installed in Moodle. Then, there is an
administrator option to allow the integration. With the administrator option
enabled, an extra link will appear in the block to configure the integration.
There are 2 settings available from within the block. The first causes Behaviour
Analytics to use the latest graph made in the LORD plugin. The second switches
between using the system generated graph and the user manipulated graph. If
there is no LORD graph to use, the graph made with Behaviour Analytics will
be used instead.
When using the LORD generated graph, it is possible to manipulate the nodes
using the "Configure resource nodes" feature. The graph will appear slightly
different, as it will have grouping nodes and their associated links. If a LORD
graph is manipulated within Behaviour Analytics, it will cease to be a LORD
graph. This means that LORD integration must be switched off to use the newly
manipulated graph. Such a graph will have all the nodes in the correct positions,
but the links will appear differently, as there will no longer be links between
nodes.
Importing and exporting data:
Adminstrators will see export and import forms in the block which are used to
export and import student resource access data. The export form has two check
boxes, one for currently enroled students and the other for previously enroled
students. Clicking the export button allows the data to be downloaded. Exporting
can also be done through Moodle's report interface by navigating to Site
Administration -> Reports -> Logs. Pick the course to export for and set the
actions to "View," then click the "Get these logs" button. Once the logs are
retrieved, scroll down to the bottom of the page and download the logs as a
Javascript Object Notation (.json) file. Exporting from the command line is also
possible by running the export-cli.php script located in the cli directory.
Running the script without parameters will show a usage message.
The import form can take a dragged and dropped file or a file can be chosen
using the "Choose a file" button. Only Javascript Object Notation (.json) file
types are accepted. The file name must also contain the first word of the course
short name to ensure that the user is importing the right data into the right
course. Either a file exported through the export form or through Moodle's report
interface can be imported.
Deleting data:
Administrators can delete course data stored by the plugin. This may be useful
when teaching a course with a new group of students. Or you may just want to
delete old data and start clean. The delete data page has 3 options to delete
clustering, graph configuration, or student log data. The clustering data is what
is made when viewing and clustering students. This includes the clustering and
membership data, as well as comment data. The graph configuration data is made
when positioning the graph nodes. Deleting this data removes all graph
configurations for the course as well as student centroid data associated with
those graph configurations. The student log data is extracted from the Moodle
logs and copied into another database table. It is the duplicated data that is
deleted, not the Moodle log data itself. Data for all users in the course is
deleted.
The dashboard:
The dashboard consists of a number of links at the top of the page that will show
different data. These include the summary tables, by graph and by iteration. The
summary by graph shows the latest iteration of clustering and its results, while
the summary by iteration shows results for all iterations. To view the summary
for a single graph configuration, the graph can be selected from the select graph
menu. Multiple configurations may be selected at once for comparison. When
viewing graph summaries it is possible to download the shown data as a CSV file,
less the bar graphs.
There is also a surveys link that allows for survey management. There are 3
surveys installed by default and there is the option to make custom surveys. The
link in the surveys menu can be used in a URL type course module to give students
access to the survey. The course id needs to be passed in the URL as well, which
is done in the settings under URL variables, where the value is "id". Currently,
a student may only take a survey once. When viewing survey responses, it is
possible to download the shown data as a CSV file.
A note about third-party Javascript Libraries:
The JavaScript part of the program makes use of some third-party libraries.
These libraries are included in the javascript directory as they were downloaded
and also in the amd/src directory. The copies in the amd/src folder do not
contain anything other than the minimum files needed for minification, while
those in the javascript directory contain license, usage, and other information.
All the libraries are licensed compatible with the GNU GPL.
v0.7.8 (2021110900)
v0.7.8
Plugin type: Blocks
Frankenstyle component name: block_behaviour
Version build number: 2021110900
Version release name: v0.7.8
Maturity: Beta
Supported Moodle versions: 3.4, 3.9, 3.10, 3.11
Repository URL (Git): https://github.com/Behaviour-Analytics/moodle-block_behaviour
Repository branch:
Repository tag:
Issue/bug tracker URL: https://github.com/VIP-Research-Group/moodle-block_behaviour/issues
This latest release has changed the settings for showing student names or numbers. The global admin setting now has the option to show names and the option to allow teachers to choose to show names. When teachers are allowed the choice, it overrides the global setting. Teachers can set the option from the block's instance setting by turning editing on, then configuring the block.
There is also a clustering dashboard available to those with the researcher role. The dashboard is still under construction, but currently features graph clustering summary tables and the beginning of a survey management system. There are 3 surveys included by default.
Short description:
Behaviour Analytics is a Moodle block plugin that is intended for extracting
sequential behaviour patterns of students from course access logs.
Long description:
Behaviour Analytics considers all the activities on a course page as nodes in a
graph. The links between nodes are the student accesses of those activities.
Each student then has a centroid point derived from their accesses to activities
and the coordinates of the nodes. The student centroids can be clustered to
group students and find common access patterns. The nodes of the graph can be
manually positioned and/or removed from the graph, which will affect the student
centroids. When students create new data for the system, the clustering results
get updated and can be replayed to visually verify the grouping remains correct
with the addition of the new data. Incorrect groupings can be manually altered.
The plugin is intended for teacher use and will not be seen by students.
Installation:
Behaviour Analytics can be installed directly from the Moodle plugin directory
by navigating to Site administration -> Plugins -> Install plugins and searching
for Behaviour Analytics. It can also be installed from a downloaded zip file or
by copying the plugin files into the blocks/behaviour directory.
Post-installation set-up:
The plugin contains some global settings that affect what a user sees when they
use the program. The settings give the option to grant or revoke the role of
researcher to any non-student user enroled in a course the plugin is installed
in. The researcher role allows the user to see the current graph configurations
and clustering results of other users in that course. The researcher can only
see another user's data, they can not change it. The settings can be accessed
as administrator from Site administration -> Plugins overview, then searching
for "Behaviour Analytics" and clicking the associated settings link.
The block also has a scheduled task that is, by default, set to run once a day.
The frequency that the task runs can be changed by going to
Site administration -> Server -> Scheduled tasks, then clicking the settings
icon for "Update Behaviour Analytics."
Usage:
With the block installed in a course, teachers and other non-student users will
be able to see and use the program. The block contains 3 links which are used to
view the graph and run clustering, position the course resource nodes, or replay
clustering results. These links are shown to anyone who can view the block. Site
administrators will also see forms for importing and exporting logs.
Configuring resource nodes:
The first step is to position the resource nodes. If this is not done prior to
viewing the graph, the nodes are given automatic positions. Clicking the link
to configure resource nodes brings up the interface, which includes the graph
of all course activities, a weight slider, and a hiearchical legend of the
nodes. Researchers will also have a menu of the other user's graph
configurations.
The weight slider controls the link weights where positive values produce nodes
that pull together and the negative value will push the nodes apart. A value of
zero causes all the nodes to remain stationary. The nodes can then be dragged
into position. Unwanted nodes can be removed by right clicking and choosing the
remove option or by unchecking the associated box in the hieararchical menu.
Hovering over a node will show the type and name of the activity as well as
bring up an interactive preview. Moving the mouse away will make the name and
preview disappear.
Viewing the graph:
With the nodes positioned, the graph can be viewed by clicking the link to view
the graph. This interface consists of the graph, a menu of students, and a time
slider. The student menu allows selection of which students behaviour to view on
the graph. The time slider allows selection of which links to view. All users
have their time start at access 1, so not all students will have links at the
far end of the time slider. The two handles control the slice of time that is
viewed. As in the positioning stage, hovering over a node will produce the name
and a preview of the activity.
Clustering students:
There is a button labeled "Cluster" above the student menu that moves from the
graph viewing stage to the clustering stage. Clicking the button will show the
same graph and student links, but with each student centroid denoted by a
triangle. There is a radio button to choose between the default weighted
geometric centroids or decomposed centroids. The slider controls the
stages of clustering. Moving the slider to the second position removes the
graph and scales the student centroids to the edge of the viewing area. The
third position on the slider allows clustering to be performed. A text box takes
the number of clusters to use or the default of 3 will be used. The clustering
can then be stepped through one iteration at a time or it can be played to
convergence by using the associated play and step buttons. The reset button will
reset the clustering stage. All the clustering results are logged in the right
side panel, which shows which cluster each student belongs to.
During clustering, student centroids and clustering centroids can have comments
added to them. Clicking a centroid will bring up a comment box to record any
notes about the cluster or its members. Hovering over a student centroid will
show that student's behaviour graph. Hovering over a clustering centroid will
show a graph of common links among members of that cluster. Unlike the student
graph, the common links graph will remain visible until the mouse is clicked
outside the graph. While the common links graph is visible, hovering over a node
will produce a preview of that node. Hovering over a link will produce previews
of both nodes attached to that link.
During clustering, it is also possible to assist the clustering algorithm by
dragging and dropping student centroids. When a student centroid is dragged away
from its original location and dropped elsewhere, the clustering centroid
closest to where the student was dropped will have that student included in the
cluster. This feature can assist the clustering algorithm when its results are
not quite what is desired based on the user's perception of the visualization.
The clustering algorithm will still need to run again and may override the
manual clustering at this point.
Replaying clustering:
With clustering results made, the replay feature can be used by clicking the
link for replaying. A user will see a menu of each clustering run they have done
which are labeled by user id, graph configuration number, and clustering run
number. Selecting an item from the menu will bring up the same graph shown at
the onset of clustering. The play and step buttons control the replay and
determine which iteration is seen. The replay can be stepped through forward or
back, but can only be played forward. Clicking a centroid will allow notes to
be added or viewed if any comment was made for that centroid during clustering.
When a clustering run has used the full time slice of the time slider and also
run to convergence, that clustering run will be updated with new student data
when it is available. This updating will change student centroids, add
iterations to the replay, and can alter the cluster membership. Using decomposed
centroids causes the centroid to align on a node and can make the student
centroid highly mobile. Geometric centroids tend to move less as there is more
data.
Manual clustering is possible during the replay, but behaves slightly
differently than initial clustering. Once the replay has reached initial
convergence, student centroids can be dragged and dropped to place them in
another cluster. The manual clustering produces a second set of clustering
centroids that are the same colour as the originals. The original set is
unchanged while the manual clusters are more transparent and represent the
changes the user has made. Both sets of clusters are updated with new data as
it is available.
Integrating with the Learning Object Relation Discovery (LORD) block:
First, the LORD plugin must be installed in Moodle. Then, there is an
administrator option to allow the integration. With the administrator option
enabled, an extra link will appear in the block to configure the integration.
There are 2 settings available from within the block. The first causes Behaviour
Analytics to use the latest graph made in the LORD plugin. The second switches
between using the system generated graph and the user manipulated graph. If
there is no LORD graph to use, the graph made with Behaviour Analytics will
be used instead.
When using the LORD generated graph, it is possible to manipulate the nodes
using the "Configure resource nodes" feature. The graph will appear slightly
different, as it will have grouping nodes and their associated links. If a LORD
graph is manipulated within Behaviour Analytics, it will cease to be a LORD
graph. This means that LORD integration must be switched off to use the newly
manipulated graph. Such a graph will have all the nodes in the correct positions,
but the links will appear differently, as there will no longer be links between
nodes.
Importing and exporting data:
Adminstrators will see export and import forms in the block which are used to
export and import student resource access data. The export form has two check
boxes, one for currently enroled students and the other for previously enroled
students. Clicking the export button allows the data to be downloaded. Exporting
can also be done through Moodle's report interface by navigating to Site
Administration -> Reports -> Logs. Pick the course to export for and set the
actions to "View," then click the "Get these logs" button. Once the logs are
retrieved, scroll down to the bottom of the page and download the logs as a
Javascript Object Notation (.json) file. Exporting from the command line is also
possible by running the export-cli.php script located in the cli directory.
Running the script without parameters will show a usage message.
The import form can take a dragged and dropped file or a file can be chosen
using the "Choose a file" button. Only Javascript Object Notation (.json) file
types are accepted. The file name must also contain the first word of the course
short name to ensure that the user is importing the right data into the right
course. Either a file exported through the export form or through Moodle's report
interface can be imported.
Deleting data:
Administrators can delete course data stored by the plugin. This may be useful
when teaching a course with a new group of students. Or you may just want to
delete old data and start clean. The delete data page has 3 options to delete
clustering, graph configuration, or student log data. The clustering data is what
is made when viewing and clustering students. This includes the clustering and
membership data, as well as comment data. The graph configuration data is made
when positioning the graph nodes. Deleting this data removes all graph
configurations for the course as well as student centroid data associated with
those graph configurations. The student log data is extracted from the Moodle
logs and copied into another database table. It is the duplicated data that is
deleted, not the Moodle log data itself. Data for all users in the course is
deleted.
The dashboard:
The dashboard is still under construction, but has some working features. The
dashboard consists of a number of links at the top of the page that will show
different data. These include the summary tables, by graph and by iteration. The
summary by graph shows the latest iteration of clustering and its results, while
the summary by iteration shows results for all iterations. To view the summary
for a single graph configuration, the graph can be selected from the select graph
menu. Multiple configurations may be selected at once for comparison. When
viewing graph summaries it is possible to download the shown data as a CSV file,
less the bar graphs.
There is also a surveys link that allows for survey management. There are 3
surveys installed by default and there is the option to make custom surveys.
Currently only Likert scale and binary choice questions are available. The link
in the surveys menu can be used in a URL type course module to give students
access to the survey. The course id needs to be passed in the URL as well, which
is done in the settings under URL variables, where the value is "id". Currently,
a student may only take a survey once. When viewing survey responses, it is
possible to download the shown data as a CSV file.
A note about third-party Javascript Libraries:
The JavaScript part of the program makes use of some third-party libraries.
These libraries are included in the javascript directory as they were downloaded
and also in the amd/src directory. The copies in the amd/src folder do not
contain anything other than the minimum files needed for minification, while
those in the javascript directory contain license, usage, and other information.
All the libraries are licensed compatible with the GNU GPL.
v0.7.6 (2021012802)
v0.7.6
Plugin type: Blocks
Frankenstyle component name: block_behaviour
Version build number: 2021012802
Version release name: v0.7.6
Maturity: Beta
Supported Moodle versions: 3.4, 3.5, 3.6, 3.7, 3.8, 3.9, 3.10
Repository URL (Git): https://github.com/Behaviour-Analytics/moodle-block_behaviour
Repository branch:
Repository tag:
Issue/bug tracker URL: https://github.com/VIP-Research-Group/moodle-block_behaviour/issues
This release sees the addition of a feature for naming clustering analysis, as
well as a few bug fixes.
Short description:
Behaviour Analytics is a Moodle block plugin that is intended for extracting
sequential behaviour patterns of students from course access logs.
Long description:
Behaviour Analytics considers all the activities on a course page as nodes in a
graph. The links between nodes are the student accesses of those activities.
Each student then has a centroid point derived from their accesses to activities
and the coordinates of the nodes. The student centroids can be clustered to
group students and find common access patterns. The nodes of the graph can be
manually positioned and/or removed from the graph, which will affect the student
centroids. When students create new data for the system, the clustering results
get updated and can be replayed to visually verify the grouping remains correct
with the addition of the new data. Incorrect groupings can be manually altered.
The plugin is intended for teacher use and will not be seen by students.
Installation:
Behaviour Analytics can be installed directly from the Moodle plugin directory
by navigating to Site administration -> Plugins -> Install plugins and searching
for Behaviour Analytics. It can also be installed from a downloaded zip file or
by copying the plugin files into the blocks/behaviour directory.
Post-installation set-up:
The plugin contains some global settings that affect what a user sees when they
use the program. The settings give the option to grant or revoke the role of
researcher to any non-student user enroled in a course the plugin is installed
in. The researcher role allows the user to see the current graph configurations
and clustering results of other users in that course. The researcher can only
see another user's data, they can not change it. The settings can be accessed
as administrator from Site administration -> Plugins overview, then searching
for "Behaviour Analytics" and clicking the associated settings link.
The block also has a scheduled task that is, by default, set to run once a day.
The frequency that the task runs can be changed by going to
Site administration -> Server -> Scheduled tasks, then clicking the settings
icon for "Update Behaviour Analytics."
Usage:
With the block installed in a course, teachers and other non-student users will
be able to see and use the program. The block contains 3 links which are used to
view the graph and run clustering, position the course resource nodes, or replay
clustering results. These links are shown to anyone who can view the block. Site
administrators will also see forms for importing and exporting logs.
Configuring resource nodes:
The first step is to position the resource nodes. If this is not done prior to
viewing the graph, the nodes are given automatic positions. Clicking the link
to configure resource nodes brings up the interface, which includes the graph
of all course activities, a weight slider, and a hiearchical legend of the
nodes. Researchers will also have a menu of the other user's graph
configurations.
The weight slider controls the link weights where positive values produce nodes
that pull together and the negative value will push the nodes apart. A value of
zero causes all the nodes to remain stationary. The nodes can then be dragged
into position. Unwanted nodes can be removed by right clicking and choosing the
remove option or by unchecking the associated box in the hieararchical menu.
Hovering over a node will show the type and name of the activity as well as
bring up an interactive preview. Moving the mouse away will make the name and
preview disappear.
Viewing the graph:
With the nodes positioned, the graph can be viewed by clicking the link to view
the graph. This interface consists of the graph, a menu of students, and a time
slider. The student menu allows selection of which students behaviour to view on
the graph. The time slider allows selection of which links to view. All users
have their time start at access 1, so not all students will have links at the
far end of the time slider. The two handles control the slice of time that is
viewed. As in the positioning stage, hovering over a node will produce the name
and a preview of the activity.
Clustering students:
There is a button labeled "Cluster" above the student menu that moves from the
graph viewing stage to the clustering stage. Clicking the button will show the
same graph and student links, but with each student centroid denoted by a
triangle. There is a radio button to choose between the default weighted
geometric centroids or decomposed centroids. The slider controls the
stages of clustering. Moving the slider to the second position removes the
graph and scales the student centroids to the edge of the viewing area. The
third position on the slider allows clustering to be performed. A text box takes
the number of clusters to use or the default of 3 will be used. The clustering
can then be stepped through one iteration at a time or it can be played to
convergence by using the associated play and step buttons. The reset button will
reset the clustering stage. All the clustering results are logged in the right
side panel, which shows which cluster each student belongs to.
During clustering, student centroids and clustering centroids can have comments
added to them. Clicking a centroid will bring up a comment box to record any
notes about the cluster or its members. Hovering over a student centroid will
show that student's behaviour graph. Hovering over a clustering centroid will
show a graph of common links among members of that cluster. Unlike the student
graph, the common links graph will remain visible until the mouse is clicked
outside the graph. While the common links graph is visible, hovering over a node
will produce a preview of that node. Hovering over a link will produce previews
of both nodes attached to that link.
During clustering, it is also possible to assist the clustering algorithm by
dragging and dropping student centroids. When a student centroid is dragged away
from its original location and dropped elsewhere, the clustering centroid
closest to where the student was dropped will have that student included in the
cluster. This feature can assist the clustering algorithm when its results are
not quite what is desired based on the user's perception of the visualization.
The clustering algorithm will still need to run again and may override the
manual clustering at this point.
Replaying clustering:
With clustering results made, the replay feature can be used by clicking the
link for replaying. A user will see a menu of each clustering run they have done
which are labeled by user id, graph configuration number, and clustering run
number. Selecting an item from the menu will bring up the same graph shown at
the onset of clustering. The play and step buttons control the replay and
determine which iteration is seen. The replay can be stepped through forward or
back, but can only be played forward. Clicking a centroid will allow notes to
be added or viewed if any comment was made for that centroid during clustering.
When a clustering run has used the full time slice of the time slider and also
run to convergence, that clustering run will be updated with new student data
when it is available. This updating will change student centroids, add
iterations to the replay, and can alter the cluster membership. Using decomposed
centroids causes the centroid to align on a node and can make the student
centroid highly mobile. Geometric centroids tend to move less as there is more
data.
Manual clustering is possible during the replay, but behaves slightly
differently than initial clustering. Once the replay has reached initial
convergence, student centroids can be dragged and dropped to place them in
another cluster. The manual clustering produces a second set of clustering
centroids that are the same colour as the originals. The original set is
unchanged while the manual clusters are more transparent and represent the
changes the user has made. Both sets of clusters are updated with new data as
it is available.
Integrating with the Learning Object Relation Discovery (LORD) block:
First, the LORD plugin must be installed in Moodle. Then, there is an
administrator option to allow the integration. With the administrator option
enabled, an extra link will appear in the block to configure the integration.
There are 2 settings available from within the block. The first causes Behaviour
Analytics to use the latest graph made in the LORD plugin. The second switches
between using the system generated graph and the user manipulated graph. If
there is no LORD graph to use, the graph made with Behaviour Analytics will
be used instead.
When using the LORD generated graph, it is possible to manipulate the nodes
using the "Configure resource nodes" feature. The graph will appear slightly
different, as it will have grouping nodes and their associated links. If a LORD
graph is manipulated within Behaviour Analytics, it will cease to be a LORD
graph. This means that LORD integration must be switched off to use the newly
manipulated graph. Such a graph will have all the nodes in the correct positions,
but the links will appear differently, as there will no longer be links between
nodes.
Importing and exporting data:
Adminstrators will see export and import forms in the block which are used to
export and import student resource access data. The export form has two check
boxes, one for currently enroled students and the other for previously enroled
students. Clicking the export button allows the data to be downloaded. Exporting
can also be done through Moodle's report interface by navigating to Site
Administration -> Reports -> Logs. Pick the course to export for and set the
actions to "View," then click the "Get these logs" button. Once the logs are
retrieved, scroll down to the bottom of the page and download the logs as a
Javascript Object Notation (.json) file. Exporting from the command line is also
possible by running the export-cli.php script located in the cli directory.
Running the script without parameters will show a usage message.
The import form can take a dragged and dropped file or a file can be chosen
using the "Choose a file" button. Only Javascript Object Notation (.json) file
types are accepted. The file name must also contain the first word of the course
short name to ensure that the user is importing the right data into the right
course. Either a file exported through the export form or through Moodle's report
interface can be imported.
A note about third-party Javascript Libraries:
The JavaScript part of the program makes use of some third-party libraries.
These libraries are included in the javascript directory as they were downloaded
and also in the amd/src directory. The copies in the amd/src folder do not
contain anything other than the minimum files needed for minification, while
those in the javascript directory contain license, usage, and other information.
All the libraries are licensed compatible with the GNU GPL.
v0.7.5 (2021012700)
v0.7.5
Plugin type: Blocks
Frankenstyle component name: block_behaviour
Version build number: 2021012700
Version release name: v0.7.5
Maturity: Beta
Supported Moodle versions: 3.4, 3.5, 3.6, 3.7, 3.8, 3.9, 3.10
Repository URL (Git): https://github.com/Behaviour-Analytics/moodle-block_behaviour
Repository branch:
Repository tag:
Issue/bug tracker URL: https://github.com/VIP-Research-Group/moodle-block_behaviour/issues
This release sees the addition of an intra-plugin navigation menu and
the ability to select students by groups when viewing and clustering.
Short description:
Behaviour Analytics is a Moodle block plugin that is intended for extracting
sequential behaviour patterns of students from course access logs.
Long description:
Behaviour Analytics considers all the activities on a course page as nodes in a
graph. The links between nodes are the student accesses of those activities.
Each student then has a centroid point derived from their accesses to activities
and the coordinates of the nodes. The student centroids can be clustered to
group students and find common access patterns. The nodes of the graph can be
manually positioned and/or removed from the graph, which will affect the student
centroids. When students create new data for the system, the clustering results
get updated and can be replayed to visually verify the grouping remains correct
with the addition of the new data. Incorrect groupings can be manually altered.
The plugin is intended for teacher use and will not be seen by students.
Installation:
Behaviour Analytics can be installed directly from the Moodle plugin directory
by navigating to Site administration -> Plugins -> Install plugins and searching
for Behaviour Analytics. It can also be installed from a downloaded zip file or
by copying the plugin files into the blocks/behaviour directory.
Post-installation set-up:
The plugin contains some global settings that affect what a user sees when they
use the program. The settings give the option to grant or revoke the role of
researcher to any non-student user enroled in a course the plugin is installed
in. The researcher role allows the user to see the current graph configurations
and clustering results of other users in that course. The researcher can only
see another user's data, they can not change it. The settings can be accessed
as administrator from Site administration -> Plugins overview, then searching
for "Behaviour Analytics" and clicking the associated settings link.
The block also has a scheduled task that is, by default, set to run once a day.
The frequency that the task runs can be changed by going to
Site administration -> Server -> Scheduled tasks, then clicking the settings
icon for "Update Behaviour Analytics."
Usage:
With the block installed in a course, teachers and other non-student users will
be able to see and use the program. The block contains 3 links which are used to
view the graph and run clustering, position the course resource nodes, or replay
clustering results. These links are shown to anyone who can view the block. Site
administrators will also see forms for importing and exporting logs.
Configuring resource nodes:
The first step is to position the resource nodes. If this is not done prior to
viewing the graph, the nodes are given automatic positions. Clicking the link
to configure resource nodes brings up the interface, which includes the graph
of all course activities, a weight slider, and a hiearchical legend of the
nodes. Researchers will also have a menu of the other user's graph
configurations.
The weight slider controls the link weights where positive values produce nodes
that pull together and the negative value will push the nodes apart. A value of
zero causes all the nodes to remain stationary. The nodes can then be dragged
into position. Unwanted nodes can be removed by right clicking and choosing the
remove option or by unchecking the associated box in the hieararchical menu.
Hovering over a node will show the type and name of the activity as well as
bring up an interactive preview. Moving the mouse away will make the name and
preview disappear.
Viewing the graph:
With the nodes positioned, the graph can be viewed by clicking the link to view
the graph. This interface consists of the graph, a menu of students, and a time
slider. The student menu allows selection of which students behaviour to view on
the graph. The time slider allows selection of which links to view. All users
have their time start at access 1, so not all students will have links at the
far end of the time slider. The two handles control the slice of time that is
viewed. As in the positioning stage, hovering over a node will produce the name
and a preview of the activity.
Clustering students:
There is a button labeled "Cluster" above the student menu that moves from the
graph viewing stage to the clustering stage. Clicking the button will show the
same graph and student links, but with each student centroid denoted by a
triangle. There is a radio button to choose between the default weighted
geometric centroids or decomposed centroids. The slider controls the
stages of clustering. Moving the slider to the second position removes the
graph and scales the student centroids to the edge of the viewing area. The
third position on the slider allows clustering to be performed. A text box takes
the number of clusters to use or the default of 3 will be used. The clustering
can then be stepped through one iteration at a time or it can be played to
convergence by using the associated play and step buttons. The reset button will
reset the clustering stage. All the clustering results are logged in the right
side panel, which shows which cluster each student belongs to.
During clustering, student centroids and clustering centroids can have comments
added to them. Clicking a centroid will bring up a comment box to record any
notes about the cluster or its members. Hovering over a student centroid will
show that student's behaviour graph. Hovering over a clustering centroid will
show a graph of common links among members of that cluster. Unlike the student
graph, the common links graph will remain visible until the mouse is clicked
outside the graph. While the common links graph is visible, hovering over a node
will produce a preview of that node. Hovering over a link will produce previews
of both nodes attached to that link.
During clustering, it is also possible to assist the clustering algorithm by
dragging and dropping student centroids. When a student centroid is dragged away
from its original location and dropped elsewhere, the clustering centroid
closest to where the student was dropped will have that student included in the
cluster. This feature can assist the clustering algorithm when its results are
not quite what is desired based on the user's perception of the visualization.
The clustering algorithm will still need to run again and may override the
manual clustering at this point.
Replaying clustering:
With clustering results made, the replay feature can be used by clicking the
link for replaying. A user will see a menu of each clustering run they have done
which are labeled by user id, graph configuration number, and clustering run
number. Selecting an item from the menu will bring up the same graph shown at
the onset of clustering. The play and step buttons control the replay and
determine which iteration is seen. The replay can be stepped through forward or
back, but can only be played forward. Clicking a centroid will allow notes to
be added or viewed if any comment was made for that centroid during clustering.
When a clustering run has used the full time slice of the time slider and also
run to convergence, that clustering run will be updated with new student data
when it is available. This updating will change student centroids, add
iterations to the replay, and can alter the cluster membership. Using decomposed
centroids causes the centroid to align on a node and can make the student
centroid highly mobile. Geometric centroids tend to move less as there is more
data.
Manual clustering is possible during the replay, but behaves slightly
differently than initial clustering. Once the replay has reached initial
convergence, student centroids can be dragged and dropped to place them in
another cluster. The manual clustering produces a second set of clustering
centroids that are the same colour as the originals. The original set is
unchanged while the manual clusters are more transparent and represent the
changes the user has made. Both sets of clusters are updated with new data as
it is available.
Integrating with the Learning Object Relation Discovery (LORD) block:
First, the LORD plugin must be installed in Moodle. Then, there is an
administrator option to allow the integration. With the administrator option
enabled, an extra link will appear in the block to configure the integration.
There are 2 settings available from within the block. The first causes Behaviour
Analytics to use the latest graph made in the LORD plugin. The second switches
between using the system generated graph and the user manipulated graph. If
there is no LORD graph to use, the graph made with Behaviour Analytics will
be used instead.
When using the LORD generated graph, it is possible to manipulate the nodes
using the "Configure resource nodes" feature. The graph will appear slightly
different, as it will have grouping nodes and their associated links. If a LORD
graph is manipulated within Behaviour Analytics, it will cease to be a LORD
graph. This means that LORD integration must be switched off to use the newly
manipulated graph. Such a graph will have all the nodes in the correct positions,
but the links will appear differently, as there will no longer be links between
nodes.
Importing and exporting data:
Adminstrators will see export and import forms in the block which are used to
export and import student resource access data. The export form has two check
boxes, one for currently enroled students and the other for previously enroled
students. Clicking the export button allows the data to be downloaded. Exporting
can also be done through Moodle's report interface by navigating to Site
Administration -> Reports -> Logs. Pick the course to export for and set the
actions to "View," then click the "Get these logs" button. Once the logs are
retrieved, scroll down to the bottom of the page and download the logs as a
Javascript Object Notation (.json) file. Exporting from the command line is also
possible by running the export-cli.php script located in the cli directory.
Running the script without parameters will show a usage message.
The import form can take a dragged and dropped file or a file can be chosen
using the "Choose a file" button. Only Javascript Object Notation (.json) file
types are accepted. The file name must also contain the first word of the course
short name to ensure that the user is importing the right data into the right
course. Either a file exported through the export form or through Moodle's report
interface can be imported.
A note about third-party Javascript Libraries:
The JavaScript part of the program makes use of some third-party libraries.
These libraries are included in the javascript directory as they were downloaded
and also in the amd/src directory. The copies in the amd/src folder do not
contain anything other than the minimum files needed for minification, while
those in the javascript directory contain license, usage, and other information.
All the libraries are licensed compatible with the GNU GPL.
v0.7.4 (2021012200)
v0.7.4
Plugin type: Blocks
Frankenstyle component name: block_behaviour
Version build number: 2021012200
Version release name: v0.7.4
Maturity: Beta
Supported Moodle versions: 3.4, 3.5, 3.6, 3.7, 3.8, 3.9, 3.10
Repository URL (Git): https://github.com/Behaviour-Analytics/moodle-block_behaviour
Repository branch: master
Repository tag:
Issue/bug tracker URL: https://github.com/VIP-Research-Group/moodle-block_behaviour/issues
Have changed a get_field() function call for getting student role id value.
Now using unique shortname instead of archetype. This is to fix a bug when
there are multiple student archetype roles in the system.
Short description:
Behaviour Analytics is a Moodle block plugin that is intended for extracting
sequential behaviour patterns of students from course access logs.
Long description:
Behaviour Analytics considers all the activities on a course page as nodes in a
graph. The links between nodes are the student accesses of those activities.
Each student then has a centroid point derived from their accesses to activities
and the coordinates of the nodes. The student centroids can be clustered to
group students and find common access patterns. The nodes of the graph can be
manually positioned and/or removed from the graph, which will affect the student
centroids. When students create new data for the system, the clustering results
get updated and can be replayed to visually verify the grouping remains correct
with the addition of the new data. Incorrect groupings can be manually altered.
The plugin is intended for teacher use and will not be seen by students.
Installation:
Behaviour Analytics can be installed directly from the Moodle plugin directory
by navigating to Site administration -> Plugins -> Install plugins and searching
for Behaviour Analytics. It can also be installed from a downloaded zip file or
by copying the plugin files into the blocks/behaviour directory.
Post-installation set-up:
The plugin contains some global settings that affect what a user sees when they
use the program. The settings give the option to grant or revoke the role of
researcher to any non-student user enroled in a course the plugin is installed
in. The researcher role allows the user to see the current graph configurations
and clustering results of other users in that course. The researcher can only
see another user's data, they can not change it. The settings can be accessed
as administrator from Site administration -> Plugins overview, then searching
for "Behaviour Analytics" and clicking the associated settings link.
The block also has a scheduled task that is, by default, set to run once a day.
The frequency that the task runs can be changed by going to
Site administration -> Server -> Scheduled tasks, then clicking the settings
icon for "Update Behaviour Analytics."
Usage:
With the block installed in a course, teachers and other non-student users will
be able to see and use the program. The block contains 3 links which are used to
view the graph and run clustering, position the course resource nodes, or replay
clustering results. These links are shown to anyone who can view the block. Site
administrators will also see forms for importing and exporting logs.
Configuring resource nodes:
The first step is to position the resource nodes. If this is not done prior to
viewing the graph, the nodes are given automatic positions. Clicking the link
to configure resource nodes brings up the interface, which includes the graph
of all course activities, a weight slider, and a hiearchical legend of the
nodes. Researchers will also have a menu of the other user's graph
configurations.
The weight slider controls the link weights where positive values produce nodes
that pull together and the negative value will push the nodes apart. A value of
zero causes all the nodes to remain stationary. The nodes can then be dragged
into position. Unwanted nodes can be removed by right clicking and choosing the
remove option or by unchecking the associated box in the hieararchical menu.
Hovering over a node will show the type and name of the activity as well as
bring up an interactive preview. Moving the mouse away will make the name and
preview disappear.
Viewing the graph:
With the nodes positioned, the graph can be viewed by clicking the link to view
the graph. This interface consists of the graph, a menu of students, and a time
slider. The student menu allows selection of which students behaviour to view on
the graph. The time slider allows selection of which links to view. All users
have their time start at access 1, so not all students will have links at the
far end of the time slider. The two handles control the slice of time that is
viewed. As in the positioning stage, hovering over a node will produce the name
and a preview of the activity.
Clustering students:
There is a button labeled "Cluster" above the student menu that moves from the
graph viewing stage to the clustering stage. Clicking the button will show the
same graph and student links, but with each student centroid denoted by a
triangle. There is a radio button to choose between the default weighted
geometric centroids or decomposed centroids. The slider controls the
stages of clustering. Moving the slider to the second position removes the
graph and scales the student centroids to the edge of the viewing area. The
third position on the slider allows clustering to be performed. A text box takes
the number of clusters to use or the default of 3 will be used. The clustering
can then be stepped through one iteration at a time or it can be played to
convergence by using the associated play and step buttons. The reset button will
reset the clustering stage. All the clustering results are logged in the right
side panel, which shows which cluster each student belongs to.
During clustering, student centroids and clustering centroids can have comments
added to them. Clicking a centroid will bring up a comment box to record any
notes about the cluster or its members. Hovering over a student centroid will
show that student's behaviour graph. Hovering over a clustering centroid will
show a graph of common links among members of that cluster. Unlike the student
graph, the common links graph will remain visible until the mouse is clicked
outside the graph. While the common links graph is visible, hovering over a node
will produce a preview of that node. Hovering over a link will produce previews
of both nodes attached to that link.
During clustering, it is also possible to assist the clustering algorithm by
dragging and dropping student centroids. When a student centroid is dragged away
from its original location and dropped elsewhere, the clustering centroid
closest to where the student was dropped will have that student included in the
cluster. This feature can assist the clustering algorithm when its results are
not quite what is desired based on the user's perception of the visualization.
The clustering algorithm will still need to run again and may override the
manual clustering at this point.
Replaying clustering:
With clustering results made, the replay feature can be used by clicking the
link for replaying. A user will see a menu of each clustering run they have done
which are labeled by user id, graph configuration number, and clustering run
number. Selecting an item from the menu will bring up the same graph shown at
the onset of clustering. The play and step buttons control the replay and
determine which iteration is seen. The replay can be stepped through forward or
back, but can only be played forward. Clicking a centroid will allow notes to
be added or viewed if any comment was made for that centroid during clustering.
When a clustering run has used the full time slice of the time slider and also
run to convergence, that clustering run will be updated with new student data
when it is available. This updating will change student centroids, add
iterations to the replay, and can alter the cluster membership. Using decomposed
centroids causes the centroid to align on a node and can make the student
centroid highly mobile. Geometric centroids tend to move less as there is more
data.
Manual clustering is possible during the replay, but behaves slightly
differently than initial clustering. Once the replay has reached initial
convergence, student centroids can be dragged and dropped to place them in
another cluster. The manual clustering produces a second set of clustering
centroids that are the same colour as the originals. The original set is
unchanged while the manual clusters are more transparent and represent the
changes the user has made. Both sets of clusters are updated with new data as
it is available.
Integrating with the Learning Object Relation Discovery (LORD) block:
First, the LORD plugin must be installed in Moodle. Then, there is an
administrator option to allow the integration. With the administrator option
enabled, an extra link will appear in the block to configure the integration.
There are 2 settings available from within the block. The first causes Behaviour
Analytics to use the latest graph made in the LORD plugin. The second switches
between using the system generated graph and the user manipulated graph. If
there is no LORD graph to use, the graph made with Behaviour Analytics will
be used instead.
When using the LORD generated graph, it is possible to manipulate the nodes
using the "Configure resource nodes" feature. The graph will appear slightly
different, as it will have grouping nodes and their associated links. If a LORD
graph is manipulated within Behaviour Analytics, it will cease to be a LORD
graph. This means that LORD integration must be switched off to use the newly
manipulated graph. Such a graph will have all the nodes in the correct positions,
but the links will appear differently, as there will no longer be links between
nodes.
Importing and exporting data:
Adminstrators will see export and import forms in the block which are used to
export and import student resource access data. The export form has two check
boxes, one for currently enroled students and the other for previously enroled
students. Clicking the export button allows the data to be downloaded. Exporting
can also be done through Moodle's report interface by navigating to Site
Administration -> Reports -> Logs. Pick the course to export for and set the
actions to "View," then click the "Get these logs" button. Once the logs are
retrieved, scroll down to the bottom of the page and download the logs as a
Javascript Object Notation (.json) file. Exporting from the command line is also
possible by running the export-cli.php script located in the cli directory.
Running the script without parameters will show a usage message.
The import form can take a dragged and dropped file or a file can be chosen
using the "Choose a file" button. Only Javascript Object Notation (.json) file
types are accepted. The file name must also contain the first word of the course
short name to ensure that the user is importing the right data into the right
course. Either a file exported through the export form or through Moodle's report
interface can be imported.
A note about third-party Javascript Libraries:
The JavaScript part of the program makes use of some third-party libraries.
These libraries are included in the javascript directory as they were downloaded
and also in the amd/src directory. The copies in the amd/src folder do not
contain anything other than the minimum files needed for minification, while
those in the javascript directory contain license, usage, and other information.
All the libraries are licensed compatible with the GNU GPL.
v0.7.3 (2021011701)
v0.7.3
Plugin type: Blocks
Frankenstyle component name: block_behaviour
Version build number: 2021011701
Version release name: v0.7.3
Maturity: Beta
Supported Moodle versions: 3.4, 3.5, 3.6, 3.7, 3.8, 3.9, 3.10
Repository URL (Git): https://github.com/Behaviour-Analytics/moodle-block_behaviour
Repository branch: master
Repository tag:
Issue/bug tracker URL: https://github.com/VIP-Research-Group/moodle-block_behaviour/issues
Added features to delete plugin data. There is now a button in the replay interface to
delete the selected clustering data. Administrators will also see a link in the block to
delete data. The delete data page allows for deleting clustering related data, graph configuration data, or the duplicated student log data.
Short description:
Behaviour Analytics is a Moodle block plugin that is intended for extracting
sequential behaviour patterns of students from course access logs.
Long description:
Behaviour Analytics considers all the activities on a course page as nodes in a
graph. The links between nodes are the student accesses of those activities.
Each student then has a centroid point derived from their accesses to activities
and the coordinates of the nodes. The student centroids can be clustered to
group students and find common access patterns. The nodes of the graph can be
manually positioned and/or removed from the graph, which will affect the student
centroids. When students create new data for the system, the clustering results
get updated and can be replayed to visually verify the grouping remains correct
with the addition of the new data. Incorrect groupings can be manually altered.
The plugin is intended for teacher use and will not be seen by students.
Installation:
Behaviour Analytics can be installed directly from the Moodle plugin directory
by navigating to Site administration -> Plugins -> Install plugins and searching
for Behaviour Analytics. It can also be installed from a downloaded zip file or
by copying the plugin files into the blocks/behaviour directory.
Post-installation set-up:
The plugin contains some global settings that affect what a user sees when they
use the program. The settings give the option to grant or revoke the role of
researcher to any non-student user enroled in a course the plugin is installed
in. The researcher role allows the user to see the current graph configurations
and clustering results of other users in that course. The researcher can only
see another user's data, they can not change it. The settings can be accessed
as administrator from Site administration -> Plugins overview, then searching
for "Behaviour Analytics" and clicking the associated settings link.
The block also has a scheduled task that is, by default, set to run once a day.
The frequency that the task runs can be changed by going to
Site administration -> Server -> Scheduled tasks, then clicking the settings
icon for "Update Behaviour Analytics."
Usage:
With the block installed in a course, teachers and other non-student users will
be able to see and use the program. The block contains 3 links which are used to
view the graph and run clustering, position the course resource nodes, or replay
clustering results. These links are shown to anyone who can view the block. Site
administrators will also see forms for importing and exporting logs.
Configuring resource nodes:
The first step is to position the resource nodes. If this is not done prior to
viewing the graph, the nodes are given automatic positions. Clicking the link
to configure resource nodes brings up the interface, which includes the graph
of all course activities, a weight slider, and a hiearchical legend of the
nodes. Researchers will also have a menu of the other user's graph
configurations.
The weight slider controls the link weights where positive values produce nodes
that pull together and the negative value will push the nodes apart. A value of
zero causes all the nodes to remain stationary. The nodes can then be dragged
into position. Unwanted nodes can be removed by right clicking and choosing the
remove option or by unchecking the associated box in the hieararchical menu.
Hovering over a node will show the type and name of the activity as well as
bring up an interactive preview. Moving the mouse away will make the name and
preview disappear.
Viewing the graph:
With the nodes positioned, the graph can be viewed by clicking the link to view
the graph. This interface consists of the graph, a menu of students, and a time
slider. The student menu allows selection of which students behaviour to view on
the graph. The time slider allows selection of which links to view. All users
have their time start at access 1, so not all students will have links at the
far end of the time slider. The two handles control the slice of time that is
viewed. As in the positioning stage, hovering over a node will produce the name
and a preview of the activity.
Clustering students:
There is a button labeled "Cluster" above the student menu that moves from the
graph viewing stage to the clustering stage. Clicking the button will show the
same graph and student links, but with each student centroid denoted by a
triangle. There is a radio button to choose between the default weighted
geometric centroids or decomposed centroids. The slider controls the
stages of clustering. Moving the slider to the second position removes the
graph and scales the student centroids to the edge of the viewing area. The
third position on the slider allows clustering to be performed. A text box takes
the number of clusters to use or the default of 3 will be used. The clustering
can then be stepped through one iteration at a time or it can be played to
convergence by using the associated play and step buttons. The reset button will
reset the clustering stage. All the clustering results are logged in the right
side panel, which shows which cluster each student belongs to.
During clustering, student centroids and clustering centroids can have comments
added to them. Clicking a centroid will bring up a comment box to record any
notes about the cluster or its members. Hovering over a student centroid will
show that student's behaviour graph. Hovering over a clustering centroid will
show a graph of common links among members of that cluster. Unlike the student
graph, the common links graph will remain visible until the mouse is clicked
outside the graph. While the common links graph is visible, hovering over a node
will produce a preview of that node. Hovering over a link will produce previews
of both nodes attached to that link.
During clustering, it is also possible to assist the clustering algorithm by
dragging and dropping student centroids. When a student centroid is dragged away
from its original location and dropped elsewhere, the clustering centroid
closest to where the student was dropped will have that student included in the
cluster. This feature can assist the clustering algorithm when its results are
not quite what is desired based on the user's perception of the visualization.
The clustering algorithm will still need to run again and may override the
manual clustering at this point.
Replaying clustering:
With clustering results made, the replay feature can be used by clicking the
link for replaying. A user will see a menu of each clustering run they have done
which are labeled by user id, graph configuration number, and clustering run
number. Selecting an item from the menu will bring up the same graph shown at
the onset of clustering. The play and step buttons control the replay and
determine which iteration is seen. The replay can be stepped through forward or
back, but can only be played forward. Clicking a centroid will allow notes to
be added or viewed if any comment was made for that centroid during clustering.
When a clustering run has used the full time slice of the time slider and also
run to convergence, that clustering run will be updated with new student data
when it is available. This updating will change student centroids, add
iterations to the replay, and can alter the cluster membership. Using decomposed
centroids causes the centroid to align on a node and can make the student
centroid highly mobile. Geometric centroids tend to move less as there is more
data.
Manual clustering is possible during the replay, but behaves slightly
differently than initial clustering. Once the replay has reached initial
convergence, student centroids can be dragged and dropped to place them in
another cluster. The manual clustering produces a second set of clustering
centroids that are the same colour as the originals. The original set is
unchanged while the manual clusters are more transparent and represent the
changes the user has made. Both sets of clusters are updated with new data as
it is available.
Integrating with the Learning Object Relation Discovery (LORD) block:
First, the LORD plugin must be installed in Moodle. Then, there is an
administrator option to allow the integration. With the administrator option
enabled, an extra link will appear in the block to configure the integration.
There are 2 settings available from within the block. The first causes Behaviour
Analytics to use the latest graph made in the LORD plugin. The second switches
between using the system generated graph and the user manipulated graph. If
there is no LORD graph to use, the graph made with Behaviour Analytics will
be used instead.
When using the LORD generated graph, it is possible to manipulate the nodes
using the "Configure resource nodes" feature. The graph will appear slightly
different, as it will have grouping nodes and their associated links. If a LORD
graph is manipulated within Behaviour Analytics, it will cease to be a LORD
graph. This means that LORD integration must be switched off to use the newly
manipulated graph. Such a graph will have all the nodes in the correct positions,
but the links will appear differently, as there will no longer be links between
nodes.
Importing and exporting data:
Adminstrators will see export and import forms in the block which are used to
export and import student resource access data. The export form has two check
boxes, one for currently enroled students and the other for previously enroled
students. Clicking the export button allows the data to be downloaded. Exporting
can also be done through Moodle's report interface by navigating to Site
Administration -> Reports -> Logs. Pick the course to export for and set the
actions to "View," then click the "Get these logs" button. Once the logs are
retrieved, scroll down to the bottom of the page and download the logs as a
Javascript Object Notation (.json) file. Exporting from the command line is also
possible by running the export-cli.php script located in the cli directory.
Running the script without parameters will show a usage message.
The import form can take a dragged and dropped file or a file can be chosen
using the "Choose a file" button. Only Javascript Object Notation (.json) file
types are accepted. The file name must also contain the first word of the course
short name to ensure that the user is importing the right data into the right
course. Either a file exported through the export form or through Moodle's report
interface can be imported.
A note about third-party Javascript Libraries:
The JavaScript part of the program makes use of some third-party libraries.
These libraries are included in the javascript directory as they were downloaded
and also in the amd/src directory. The copies in the amd/src folder do not
contain anything other than the minimum files needed for minification, while
those in the javascript directory contain license, usage, and other information.
All the libraries are licensed compatible with the GNU GPL.
v0.7.1 (2020110600)
v0.7.1
Plugin type: Blocks
Frankenstyle component name: block_behaviour
Version build number: 2020110600
Version release name: v0.7.1
Maturity: Alpha
Supported Moodle versions: 3.4, 3.5, 3.6, 3.7, 3.8, 3.9, 3.10
Repository URL (Git): https://github.com/Behaviour-Analytics/moodle-block_behaviour
Repository branch:
Repository tag:
Issue/bug tracker URL: https://github.com/VIP-Research-Group/moodle-block_behaviour/issues
New features for v0.7.1:
- Option to show unique study id for students
- Export complete anonymized data set
- Option to show student names instead of sequential numbers
- Interface enhancements
- Integrates with Learning Object Relation Discovery (LORD) plugin (just submitted to Moodle plugin directory, can be found on GitHub in the meantime https://github.com/Behaviour-Analytics/moodle-block_lord)
- Many bug fixes
Short description:
Behaviour Analytics is a Moodle block plugin that is intended for extracting
sequential behaviour patterns of students from course access logs.
Long description:
Behaviour Analytics considers all the activities on a course page as nodes in a
graph. The links between nodes are the student accesses of those activities.
Each student then has a centroid point derived from their accesses to activities
and the coordinates of the nodes. The student centroids can be clustered to
group students and find common access patterns. The nodes of the graph can be
manually positioned and/or removed from the graph, which will affect the student
centroids. When students create new data for the system, the clustering results
get updated and can be replayed to visually verify the grouping remains correct
with the addition of the new data. Incorrect groupings can be manually altered.
The plugin is intended for teacher use and will not be seen by students.
Installation:
Behaviour Analytics can be installed directly from the Moodle plugin directory
by navigating to Site administration -> Plugins -> Install plugins and searching
for Behaviour Analytics. It can also be installed from a downloaded zip file or
by copying the plugin files into the blocks/behaviour directory.
Post-installation set-up:
The plugin contains some global settings that affect what a user sees when they
use the program. The settings give the option to grant or revoke the role of
researcher to any non-student user enroled in a course the plugin is installed
in. The researcher role allows the user to see the current graph configurations
and clustering results of other users in that course. The researcher can only
see another user's data, they can not change it. The settings can be accessed
as administrator from Site administration -> Plugins overview, then searching
for "Behaviour Analytics" and clicking the associated settings link.
The block also has a scheduled task that is, by default, set to run once a day.
The frequency that the task runs can be changed by going to
Site administration -> Server -> Scheduled tasks, then clicking the settings
icon for "Update Behaviour Analytics."
Usage:
With the block installed in a course, teachers and other non-student users will
be able to see and use the program. The block contains 3 links which are used to
view the graph and run clustering, position the course resource nodes, or replay
clustering results. These links are shown to anyone who can view the block. Site
administrators will also see forms for importing and exporting logs.
Configuring resource nodes:
The first step is to position the resource nodes. If this is not done prior to
viewing the graph, the nodes are given automatic positions. Clicking the link
to configure resource nodes brings up the interface, which includes the graph
of all course activities, a weight slider, and a hiearchical legend of the
nodes. Researchers will also have a menu of the other user's graph
configurations.
The weight slider controls the link weights where positive values produce nodes
that pull together and the negative value will push the nodes apart. A value of
zero causes all the nodes to remain stationary. The nodes can then be dragged
into position. Unwanted nodes can be removed by right clicking and choosing the
remove option or by unchecking the associated box in the hieararchical menu.
Hovering over a node will show the type and name of the activity as well as
bring up an interactive preview. Moving the mouse away will make the name and
preview disappear.
Viewing the graph:
With the nodes positioned, the graph can be viewed by clicking the link to view
the graph. This interface consists of the graph, a menu of students, and a time
slider. The student menu allows selection of which students behaviour to view on
the graph. The time slider allows selection of which links to view. All users
have their time start at access 1, so not all students will have links at the
far end of the time slider. The two handles control the slice of time that is
viewed. As in the positioning stage, hovering over a node will produce the name
and a preview of the activity.
Clustering students:
There is a button labeled "Cluster" above the student menu that moves from the
graph viewing stage to the clustering stage. Clicking the button will show the
same graph and student links, but with each student centroid denoted by a
triangle. There is a radio button to choose between the default weighted
geometric centroids or decomposed centroids. The slider controls the
stages of clustering. Moving the slider to the second position removes the
graph and scales the student centroids to the edge of the viewing area. The
third position on the slider allows clustering to be performed. A text box takes
the number of clusters to use or the default of 3 will be used. The clustering
can then be stepped through one iteration at a time or it can be played to
convergence by using the associated play and step buttons. The reset button will
reset the clustering stage. All the clustering results are logged in the right
side panel, which shows which cluster each student belongs to.
During clustering, student centroids and clustering centroids can have comments
added to them. Clicking a centroid will bring up a comment box to record any
notes about the cluster or its members. Hovering over a student centroid will
show that student's behaviour graph. Hovering over a clustering centroid will
show a graph of common links among members of that cluster. Unlike the student
graph, the common links graph will remain visible until the mouse is clicked
outside the graph. While the common links graph is visible, hovering over a node
will produce a preview of that node. Hovering over a link will produce previews
of both nodes attached to that link.
During clustering, it is also possible to assist the clustering algorithm by
dragging and dropping student centroids. When a student centroid is dragged away
from its original location and dropped elsewhere, the clustering centroid
closest to where the student was dropped will have that student included in the
cluster. This feature can assist the clustering algorithm when its results are
not quite what is desired based on the user's perception of the visualization.
The clustering algorithm will still need to run again and may override the
manual clustering at this point.
Replaying clustering:
With clustering results made, the replay feature can be used by clicking the
link for replaying. A user will see a menu of each clustering run they have done
which are labeled by user id, graph configuration number, and clustering run
number. Selecting an item from the menu will bring up the same graph shown at
the onset of clustering. The play and step buttons control the replay and
determine which iteration is seen. The replay can be stepped through forward or
back, but can only be played forward. Clicking a centroid will allow notes to
be added or viewed if any comment was made for that centroid during clustering.
When a clustering run has used the full time slice of the time slider and also
run to convergence, that clustering run will be updated with new student data
when it is available. This updating will change student centroids, add
iterations to the replay, and can alter the cluster membership. Using decomposed
centroids causes the centroid to align on a node and can make the student
centroid highly mobile. Geometric centroids tend to move less as there is more
data.
Manual clustering is possible during the replay, but behaves slightly
differently than initial clustering. Once the replay has reached initial
convergence, student centroids can be dragged and dropped to place them in
another cluster. The manual clustering produces a second set of clustering
centroids that are the same colour as the originals. The original set is
unchanged while the manual clusters are more transparent and represent the
changes the user has made. Both sets of clusters are updated with new data as
it is available.
Integrating with the Learning Object Relation Discovery (LORD) block:
First, the LORD plugin must be installed in Moodle. Then, there is an
administrator option to allow the integration. With the administrator option
enabled, an extra link will appear in the block to configure the integration.
There are 2 settings available from within the block. The first causes Behaviour
Analytics to use the latest graph made in the LORD plugin. The second switches
between using the system generated graph and the user manipulated graph. If
there is no LORD graph to use, the graph made with Behaviour Analytics will
be used instead.
When using the LORD generated graph, it is possible to manipulate the nodes
using the "Configure resource nodes" feature. The graph will appear slightly
different, as it will have grouping nodes and their associated links. If a LORD
graph is manipulated within Behaviour Analytics, it will cease to be a LORD
graph. This means that LORD integration must be switched off to use the newly
manipulated graph. Such a graph will have all the nodes in the correct positions,
but the links will appear differently, as there will no longer be links between
nodes.
Importing and exporting data:
Adminstrators will see export and import forms in the block which are used to
export and import student resource access data. The export form has two check
boxes, one for currently enroled students and the other for previously enroled
students. Clicking the export button allows the data to be downloaded. Exporting
can also be done through Moodle's report interface by navigating to Site
Administration -> Reports -> Logs. Pick the course to export for and set the
actions to "View," then click the "Get these logs" button. Once the logs are
retrieved, scroll down to the bottom of the page and download the logs as a
Javascript Object Notation (.json) file. Exporting from the command line is also
possible by running the export-cli.php script located in the cli directory.
Running the script without parameters will show a usage message.
The import form can take a dragged and dropped file or a file can be chosen
using the "Choose a file" button. Only Javascript Object Notation (.json) file
types are accepted. The file name must also contain the first word of the course
short name to ensure that the user is importing the right data into the right
course. Either a file exported through the export form or through Moodle's report
interface can be imported.
A note about third-party Javascript Libraries:
The JavaScript part of the program makes use of some third-party libraries.
These libraries are included in the javascript directory as they were downloaded
and also in the amd/src directory. The copies in the amd/src folder do not
contain anything other than the minimum files needed for minification, while
those in the javascript directory contain license, usage, and other information.
All the libraries are licensed compatible with the GNU GPL.
v0.6.2 (2020092201)
v0.6.2
Plugin type: Blocks
Frankenstyle component name: block_behaviour
Version build number: 2020092201
Version release name: v0.6.2
Maturity: Alpha
Supported Moodle versions: 3.2, 3.4, 3.5, 3.6, 3.7, 3.8, 3.9
Repository URL (Git): https://github.com/Behaviour-Analytics/moodle-block_behaviour
Repository branch:
Repository tag:
Issue/bug tracker URL: https://github.com/VIP-Research-Group/moodle-block_behaviour/issues
Short description:
Behaviour Analytics is a Moodle block plugin that is intended for extracting
sequential behaviour patterns of students from course access logs.
Long description:
Behaviour Analytics considers all the activities on a course page as nodes in a
graph. The links between nodes are the student accesses of those activities.
Each student then has a centroid point derived from their accesses to activities
and the coordinates of the nodes. The student centroids can be clustered to
group students and find common access patterns. The nodes of the graph can be
manually positioned and/or removed from the graph, which will affect the student
centroids. When students create new data for the system, the clustering results
get updated and can be replayed to visually verify the grouping remains correct
with the addition of the new data. Incorrect groupings can be manually altered.
The plugin is intended for teacher use and will not be seen by students.
Installation:
Behaviour Analytics installs as any other block would, from a zip file through the
Moodle interface for installing new plugins. It can also be installed by copying
the plugin files into a behaviour directory within the blocks directory.
Post-installation set-up:
The plugin contains some global settings that affect what a user sees when they
use the program. The settings give the option to grant or revoke the role of
researcher to any non-student user enroled in a course the plugin is installed
in. The researcher role allows the user to see the current graph configurations
and clustering results of other users in that course. The researcher can only
see another user's data, they can not change it. The settings can be accessed
as administrator from Site administration -> Plugins overview, then searching
for "Behaviour Analytics" and clicking the associated settings link.
The block also has a scheduled task that is, by default, set to run once a day.
The frequency that the task runs can be changed by going to
Site administration -> Server -> Scheduled tasks, then clicking the settings
icon for "Incrementally extract logs."
Usage:
With the block installed in a course, teachers and other non-student users will
be able to see and use the program. The block contains 3 links which are used to
view the graph and run clustering, position the course resource nodes, or replay
clustering results. These links are shown to anyone who can view the block. Site
administrators will also see forms for importing and exporting logs.
Configuring resource nodes:
The first step is to position the resource nodes. If this is not done prior to
viewing the graph, the nodes are given automatic positions. Clicking the link
to configure resource nodes brings up the interface, which includes the graph
of all course activities, a weight slider, and a hiearchical legend of the
nodes. Researchers will also have a menu of the other user's graph
configurations.
The weight slider controls the link weights where positive values produce nodes
that pull together and the negative value will push the nodes apart. A value of
zero causes all the nodes to remain stationary. The nodes can then be dragged
into position. Unwanted nodes can be removed by right clicking and choosing the
remove option or by unchecking the associated box in the hieararchical legend.
Hovering over a node will show the type and name of the activity as well as
bring up a preview that can then be interacted with. Moving the mouse away will
make the name and preview disappear.
Viewing the graph:
With the nodes positioned, the graph can be viewed by clicking the link to view
the graph. This interface consists of the graph, a menu of students, and a time
slider. The student menu allows selection of which students behaviour to view on
the graph. The time slider allows selection of which links to view. All users
have their time start at access 1, so not all students will have links at the
far end of the time slider. The two handles control the slice of time that is
viewed. As in the positioning stage, hovering over a node will produce the name
and a preview of the activity.
Clustering students:
There is a button labeled "Cluster" above the student menu that moves from the
graph viewing stage to the clustering stage. Clicking the button will show the
same graph and student links, but with each student centroid denoted by a
triangle. There is a checkbox to choose between the default decomposed centroids
or weighted geometric centroids. The slider in the clustering interface controls
the stages of clustering. Moving the slider to the second position removes the
graph and scales the student centroids to the edge of the viewing area. The
third position on the slider allows clustering to be performed. A text box takes
the number of clusters to use or the default of 3 will be used. The clustering
can then be stepped through one iteration at a time or it can be played to
convergence by using the associated play and step buttons. The stop button will
reset the clustering stage. All the clustering results are logged in the right
side panel which shows which cluster each student belongs to.
During clustering, student centroids and clustering centroids can have comments
added to them. Clicking a centroid will bring up a comment box to record any
notes about the cluster or its members. Hovering over a student centroid will
show that student's behaviour graph. Hovering over a clustering centroid will
show a graph of common links among members of that cluster. Unlike the student
graph, the common links graph will remain visible until the mouse is clicked
outside the graph. While the common links graph is visible, hovering over a node
will produce a preview of that node. Hovering over a link will produce previews
of both nodes attached to that link.
During clustering, it is also possible to assist the clustering algorithm by
dragging and dropping student centroids. When a student centroid is dragged away
from its original location and dropped elsewhere, the clustering centroid
closest to where the student was dropped will have that student included in the
cluster. This feature can assist the clustering algorithm when its results are
not quite what is desired based on the user's perception of the visualization.
The clustering algorithm will still need to run again and may override the
manual clustering at this point.
Replaying clustering:
With clustering results made, the replay feature can be used by clicking the
link for replaying. A user will see a menu of each clustering run they have done
which are labeled by user id, graph configuration number, and clustering run
number. Selecting an item from the menu will bring up the same graph shown at
the onset of clustering. The play and step buttons control the replay and
determine which iteration is seen. The replay can be stepped through forward or
back, but can only be played forward. Clicking a centroid will allow notes to
be added or viewed if any comment was made for that centroid during clustering.
When a clustering run has used the full time slice of the time slider and also
run to convergence, that clustering run will be updated with new student data
when it is available. This updating will change student centroids, add
iterations to the replay, and can alter the cluster membership. Using decomposed
centroids causes the centroid to align on a node and can make the student
centroid highly mobile. Geometric centroids tend to move less as there is more
data.
Manual clustering is possible during the replay, but behaves slightly
differently than initial clustering. Once the replay has reached initial
convergence, student centroids can be dragged and dropped to place them in
another cluster. The manual clustering produces a second set of clustering
centroids that are the same colour as the originals. The original set is
unchanged while the manual clusters are more transparent and represent the
changes the user has made. Both sets of clusters are updated with new data as
it is available.
Importing and exporting data:
Adminstrators will see export and import forms in the block which are used to
export and import student resource access data. The export form has two check
boxes, one for currently enroled students and the other for previously enroled
students. Clicking the export button allows the data to be downloaded. Exporting
can also be done through Moodle's report interface by navigating to Site
Administration -> Reports -> Logs. Pick the course to export for and set the
actions to "View," then click the "Get these logs" button. Once the logs are
retrieved, scroll down to the bottom of the page and download the logs as a
Javascript Object Notation (.json) file. Exporting from the command line is also
possible by running the export-cli.php script located in the cli directory.
Running the script without parameters will show a usage message.
The import form can take a dragged and dropped file or a file can be chosen
using the "Choose a file" button. Only Javascript Object Notation (.json) file
types are accepted. The file name must also contain the first word of the course
short name to ensure that the user is importing the right data into the right
course. Either a file exported through the export form or through Moodle's report
interface can be imported.
A note about third-party Javascript Libraries:
The JavaScript part of the program makes use of some third-party libraries.
These libraries are included in the javascript directory as they were downloaded
and also in the amd/src directory. The copies in the amd/src folder do not
contain anything other than the minimum files needed for minification, while
those in the javascript directory contain license, usage, and other information.
All the libraries are licensed compatible with the GNU GPL.
v0.6.2 (2020092200)
v0.6.2
Plugin type: Blocks
Frankenstyle component name: block_behaviour
Version build number: 2020092200
Version release name: v0.6.2
Maturity: Stable
Supported Moodle versions: 3.2, 3.4, 3.5, 3.6, 3.7, 3.8, 3.9
Repository URL (Git): https://github.com/Behaviour-Analytics/moodle-block_behaviour
Repository branch: master
Repository tag:
Issue/bug tracker URL: https://github.com/VIP-Research-Group/moodle-block_behaviour/issues
Short description:
Behaviour Analytics is a Moodle block plugin that is intended for extracting
sequential behaviour patterns of students from course access logs.
Long description:
Behaviour Analytics considers all the activities on a course page as nodes in a
graph. The links between nodes are the student accesses of those activities.
Each student then has a centroid point derived from their accesses to activities
and the coordinates of the nodes. The student centroids can be clustered to
group students and find common access patterns. The nodes of the graph can be
manually positioned and/or removed from the graph, which will affect the student
centroids. When students create new data for the system, the clustering results
get updated and can be replayed to visually verify the grouping remains correct
with the addition of the new data. Incorrect groupings can be manually altered.
The plugin is intended for teacher use and will not be seen by students.
Installation:
Behaviour Analytics installs as any other block would, from a zip file through the
Moodle interface for installing new plugins. It can also be installed by copying
the plugin files into a behaviour directory within the blocks directory.
Post-installation set-up:
The plugin contains some global settings that affect what a user sees when they
use the program. The settings give the option to grant or revoke the role of
researcher to any non-student user enroled in a course the plugin is installed
in. The researcher role allows the user to see the current graph configurations
and clustering results of other users in that course. The researcher can only
see another user's data, they can not change it. The settings can be accessed
as administrator from Site administration -> Plugins overview, then searching
for "Behaviour Analytics" and clicking the associated settings link.
The block also has a scheduled task that is, by default, set to run once a day.
The frequency that the task runs can be changed by going to
Site administration -> Server -> Scheduled tasks, then clicking the settings
icon for "Incrementally extract logs."
Usage:
With the block installed in a course, teachers and other non-student users will
be able to see and use the program. The block contains 3 links which are used to
view the graph and run clustering, position the course resource nodes, or replay
clustering results. These links are shown to anyone who can view the block. Site
administrators will also see forms for importing and exporting logs.
Configuring resource nodes:
The first step is to position the resource nodes. If this is not done prior to
viewing the graph, the nodes are given automatic positions. Clicking the link
to configure resource nodes brings up the interface, which includes the graph
of all course activities, a weight slider, and a hiearchical legend of the
nodes. Researchers will also have a menu of the other user's graph
configurations.
The weight slider controls the link weights where positive values produce nodes
that pull together and the negative value will push the nodes apart. A value of
zero causes all the nodes to remain stationary. The nodes can then be dragged
into position. Unwanted nodes can be removed by right clicking and choosing the
remove option or by unchecking the associated box in the hieararchical legend.
Hovering over a node will show the type and name of the activity as well as
bring up a preview that can then be interacted with. Moving the mouse away will
make the name and preview disappear.
Viewing the graph:
With the nodes positioned, the graph can be viewed by clicking the link to view
the graph. This interface consists of the graph, a menu of students, and a time
slider. The student menu allows selection of which students behaviour to view on
the graph. The time slider allows selection of which links to view. All users
have their time start at access 1, so not all students will have links at the
far end of the time slider. The two handles control the slice of time that is
viewed. As in the positioning stage, hovering over a node will produce the name
and a preview of the activity.
Clustering students:
There is a button labeled "Cluster" above the student menu that moves from the
graph viewing stage to the clustering stage. Clicking the button will show the
same graph and student links, but with each student centroid denoted by a
triangle. There is a checkbox to choose between the default decomposed centroids
or weighted geometric centroids. The slider in the clustering interface controls
the stages of clustering. Moving the slider to the second position removes the
graph and scales the student centroids to the edge of the viewing area. The
third position on the slider allows clustering to be performed. A text box takes
the number of clusters to use or the default of 3 will be used. The clustering
can then be stepped through one iteration at a time or it can be played to
convergence by using the associated play and step buttons. The stop button will
reset the clustering stage. All the clustering results are logged in the right
side panel which shows which cluster each student belongs to.
During clustering, student centroids and clustering centroids can have comments
added to them. Clicking a centroid will bring up a comment box to record any
notes about the cluster or its members. Hovering over a student centroid will
show that student's behaviour graph. Hovering over a clustering centroid will
show a graph of common links among members of that cluster. Unlike the student
graph, the common links graph will remain visible until the mouse is clicked
outside the graph. While the common links graph is visible, hovering over a node
will produce a preview of that node. Hovering over a link will produce previews
of both nodes attached to that link.
During clustering, it is also possible to assist the clustering algorithm by
dragging and dropping student centroids. When a student centroid is dragged away
from its original location and dropped elsewhere, the clustering centroid
closest to where the student was dropped will have that student included in the
cluster. This feature can assist the clustering algorithm when its results are
not quite what is desired based on the user's perception of the visualization.
The clustering algorithm will still need to run again and may override the
manual clustering at this point.
Replaying clustering:
With clustering results made, the replay feature can be used by clicking the
link for replaying. A user will see a menu of each clustering run they have done
which are labeled by user id, graph configuration number, and clustering run
number. Selecting an item from the menu will bring up the same graph shown at
the onset of clustering. The play and step buttons control the replay and
determine which iteration is seen. The replay can be stepped through forward or
back, but can only be played forward. Clicking a centroid will allow notes to
be added or viewed if any comment was made for that centroid during clustering.
When a clustering run has used the full time slice of the time slider and also
run to convergence, that clustering run will be updated with new student data
when it is available. This updating will change student centroids, add
iterations to the replay, and can alter the cluster membership. Using decomposed
centroids causes the centroid to align on a node and can make the student
centroid highly mobile. Geometric centroids tend to move less as there is more
data.
Manual clustering is possible during the replay, but behaves slightly
differently than initial clustering. Once the replay has reached initial
convergence, student centroids can be dragged and dropped to place them in
another cluster. The manual clustering produces a second set of clustering
centroids that are the same colour as the originals. The original set is
unchanged while the manual clusters are more transparent and represent the
changes the user has made. Both sets of clusters are updated with new data as
it is available.
Importing and exporting data:
Adminstrators will see export and import forms in the block which are used to
export and import student resource access data. The export form has two check
boxes, one for currently enroled students and the other for previously enroled
students. Clicking the export button allows the data to be downloaded. Exporting
can also be done through Moodle's report interface by navigating to Site
Administration -> Reports -> Logs. Pick the course to export for and set the
actions to "View," then click the "Get these logs" button. Once the logs are
retrieved, scroll down to the bottom of the page and download the logs as a
Javascript Object Notation (.json) file. Exporting from the command line is also
possible by running the export-cli.php script located in the cli directory.
Running the script without parameters will show a usage message.
The import form can take a dragged and dropped file or a file can be chosen
using the "Choose a file" button. Only Javascript Object Notation (.json) file
types are accepted. The file name must also contain the first word of the course
short name to ensure that the user is importing the right data into the right
course. Either a file exported through the export form or through Moodle's report
interface can be imported.
A note about third-party Javascript Libraries:
The JavaScript part of the program makes use of some third-party libraries.
These libraries are included in the javascript directory as they were downloaded
and also in the amd/src directory. The copies in the amd/src folder do not
contain anything other than the minimum files needed for minification, while
those in the javascript directory contain license, usage, and other information.
All the libraries are licensed compatible with the GNU GPL.
v0.6.2 (2020051100)
v0.6.2
Plugin type: Blocks
Frankenstyle component name: block_behaviour
Version build number: 2020051100
Version release name: v0.6.2
Maturity: Alpha
Supported Moodle versions: 3.4, 3.5, 3.6, 3.7, 3.8
Repository URL (Git): https://github.com/Behaviour-Analytics/moodle-block_behaviour
Repository branch:
Repository tag:
Issue/bug tracker URL: https://github.com/VIP-Research-Group/moodle-block_behaviour/issues
Short description:
Behaviour Analytics is a Moodle block plugin that is intended for extracting
sequential behaviour patterns of students from course access logs.
Long description:
Behaviour Analytics considers all the activities on a course page as nodes in a
graph. The links between nodes are the student accesses of those activities.
Each student then has a centroid point derived from their accesses to activities
and the coordinates of the nodes. The student centroids can be clustered to
group students and find common access patterns. The nodes of the graph can be
manually positioned and/or removed from the graph, which will affect the student
centroids. When students create new data for the system, the clustering results
get updated and can be replayed to visually verify the grouping remains correct
with the addition of the new data. Incorrect groupings can be manually altered.
The plugin is intended for teacher use and will not be seen by students.
Installation:
Behaviour Analytics installs as any other block would, from a zip file through the
Moodle interface for installing new plugins. It can also be installed by copying
the plugin files into a behaviour directory within the blocks directory.
Post-installation set-up:
The plugin contains some global settings that affect what a user sees when they
use the program. The settings give the option to grant or revoke the role of
researcher to any non-student user enroled in a course the plugin is installed
in. The researcher role allows the user to see the current graph configurations
and clustering results of other users in that course. The researcher can only
see another user's data, they can not change it. The settings can be accessed
as administrator from Site administration -> Plugins overview, then searching
for "Behaviour Analytics" and clicking the associated settings link.
The block also has a scheduled task that is, by default, set to run once a day.
The frequency that the task runs can be changed by going to
Site administration -> Server -> Scheduled tasks, then clicking the settings
icon for "Incrementally extract logs."
Usage:
With the block installed in a course, teachers and other non-student users will
be able to see and use the program. The block contains 3 links which are used to
view the graph and run clustering, position the course resource nodes, or replay
clustering results. These links are shown to anyone who can view the block. Site
administrators will also see forms for importing and exporting logs.
Configuring resource nodes:
The first step is to position the resource nodes. If this is not done prior to
viewing the graph, the nodes are given automatic positions. Clicking the link
to configure resource nodes brings up the interface, which includes the graph
of all course activities, a weight slider, and a hiearchical legend of the
nodes. Researchers will also have a menu of the other user's graph
configurations.
The weight slider controls the link weights where positive values produce nodes
that pull together and the negative value will push the nodes apart. A value of
zero causes all the nodes to remain stationary. The nodes can then be dragged
into position. Unwanted nodes can be removed by right clicking and choosing the
remove option or by unchecking the associated box in the hieararchical legend.
Hovering over a node will show the type and name of the activity as well as
bring up a preview that can then be interacted with. Moving the mouse away will
make the name and preview disappear.
Viewing the graph:
With the nodes positioned, the graph can be viewed by clicking the link to view
the graph. This interface consists of the graph, a menu of students, and a time
slider. The student menu allows selection of which students behaviour to view on
the graph. The time slider allows selection of which links to view. All users
have their time start at access 1, so not all students will have links at the
far end of the time slider. The two handles control the slice of time that is
viewed. As in the positioning stage, hovering over a node will produce the name
and a preview of the activity.
Clustering students:
There is a button labeled "Cluster" above the student menu that moves from the
graph viewing stage to the clustering stage. Clicking the button will show the
same graph and student links, but with each student centroid denoted by a
triangle. There is a checkbox to choose between the default decomposed centroids
or weighted geometric centroids. The slider in the clustering interface controls
the stages of clustering. Moving the slider to the second position removes the
graph and scales the student centroids to the edge of the viewing area. The
third position on the slider allows clustering to be performed. A text box takes
the number of clusters to use or the default of 3 will be used. The clustering
can then be stepped through one iteration at a time or it can be played to
convergence by using the associated play and step buttons. The stop button will
reset the clustering stage. All the clustering results are logged in the right
side panel which shows which cluster each student belongs to.
During clustering, student centroids and clustering centroids can have comments
added to them. Clicking a centroid will bring up a comment box to record any
notes about the cluster or its members. Hovering over a student centroid will
show that student's behaviour graph. Hovering over a clustering centroid will
show a graph of common links among members of that cluster. Unlike the student
graph, the common links graph will remain visible until the mouse is clicked
outside the graph. While the common links graph is visible, hovering over a node
will produce a preview of that node. Hovering over a link will produce previews
of both nodes attached to that link.
During clustering, it is also possible to assist the clustering algorithm by
dragging and dropping student centroids. When a student centroid is dragged away
from its original location and dropped elsewhere, the clustering centroid
closest to where the student was dropped will have that student included in the
cluster. This feature can assist the clustering algorithm when its results are
not quite what is desired based on the user's perception of the visualization.
The clustering algorithm will still need to run again and may override the
manual clustering at this point.
Replaying clustering:
With clustering results made, the replay feature can be used by clicking the
link for replaying. A user will see a menu of each clustering run they have done
which are labeled by user id, graph configuration number, and clustering run
number. Selecting an item from the menu will bring up the same graph shown at
the onset of clustering. The play and step buttons control the replay and
determine which iteration is seen. The replay can be stepped through forward or
back, but can only be played forward. Clicking a centroid will allow notes to
be added or viewed if any comment was made for that centroid during clustering.
When a clustering run has used the full time slice of the time slider and also
run to convergence, that clustering run will be updated with new student data
when it is available. This updating will change student centroids, add
iterations to the replay, and can alter the cluster membership. Using decomposed
centroids causes the centroid to align on a node and can make the student
centroid highly mobile. Geometric centroids tend to move less as there is more
data.
Manual clustering is possible during the replay, but behaves slightly
differently than initial clustering. Once the replay has reached initial
convergence, student centroids can be dragged and dropped to place them in
another cluster. The manual clustering produces a second set of clustering
centroids that are the same colour as the originals. The original set is
unchanged while the manual clusters are more transparent and represent the
changes the user has made. Both sets of clusters are updated with new data as
it is available.
Importing and exporting data:
Adminstrators will see export and import forms in the block which are used to
export and import student resource access data. The export form has two check
boxes, one for currently enroled students and the other for previously enroled
students. Clicking the export button allows the data to be downloaded. Exporting
can also be done through Moodle's report interface by navigating to Site
Administration -> Reports -> Logs. Pick the course to export for and set the
actions to "View," then click the "Get these logs" button. Once the logs are
retrieved, scroll down to the bottom of the page and download the logs as a
Javascript Object Notation (.json) file. Exporting from the command line is also
possible by running the export-cli.php script located in the cli directory.
Running the script without parameters will show a usage message.
The import form can take a dragged and dropped file or a file can be chosen
using the "Choose a file" button. Only Javascript Object Notation (.json) file
types are accepted. The file name must also contain the first word of the course
short name to ensure that the user is importing the right data into the right
course. Either a file exported through the export form or through Moodle's report
interface can be imported.
A note about third-party Javascript Libraries:
The JavaScript part of the program makes use of some third-party libraries.
These libraries are included in the javascript directory as they were downloaded
and also in the amd/src directory. The copies in the amd/src folder do not
contain anything other than the minimum files needed for minification, while
those in the javascript directory contain license, usage, and other information.
All the libraries are licensed compatible with the GNU GPL.
v0.6.2 (2019121600)
v0.6.2
Plugin type: Blocks
Frankenstyle component name: block_behaviour
Version build number: 2019121600
Version release name: v0.6.2
Maturity: Alpha
Supported Moodle versions: 3.4, 3.8
Repository URL (Git): https://github.com/Behaviour-Analytics/moodle-block_behaviour
Repository branch: master
Repository tag:
Issue/bug tracker URL: https://github.com/VIP-Research-Group/moodle-block_behaviour/issues
Behaviour Analytics considers all the activities on a course page as nodes in a
graph. The links between nodes are the student accesses of those activities.
Each student then has a centroid point derived from their accesses to activities
and the coordinates of the nodes. The student centroids can be clustered to
group students and find common access patterns. The nodes of the graph can be
manually positioned and/or removed from the graph, which will affect the student
centroids. When students create new data for the system, the clustering results
get updated and can be replayed to visually verify the grouping remains correct
with the addition of the new data. Incorrect groupings can be manually altered.
The plugin is intended for teacher use and will not be seen by students.