Growth report
Maintained by
Renaat Debleu
The report shows historical information using graphs about your Moodle installation.

Comments
Comments are no longer open for new posts. Existing comments remain available to read.
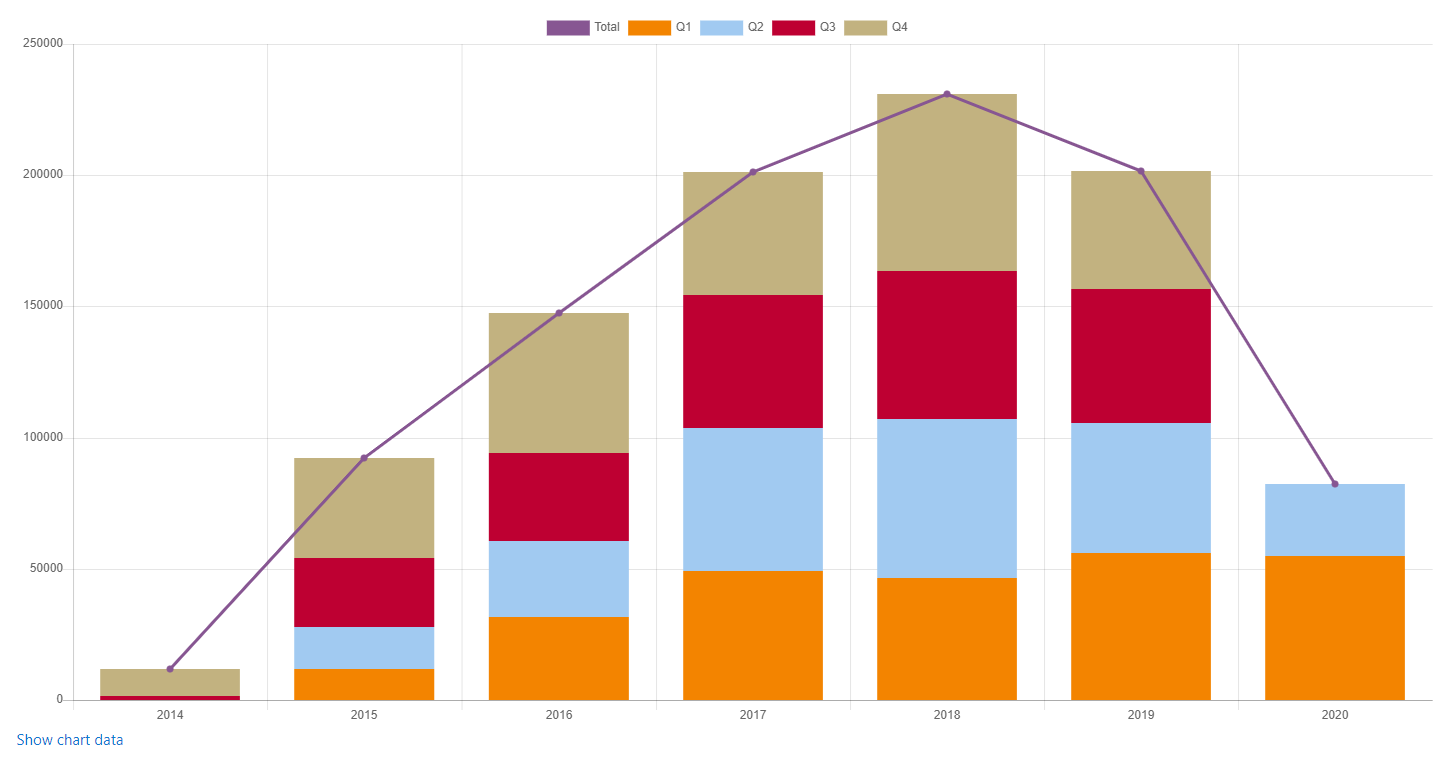
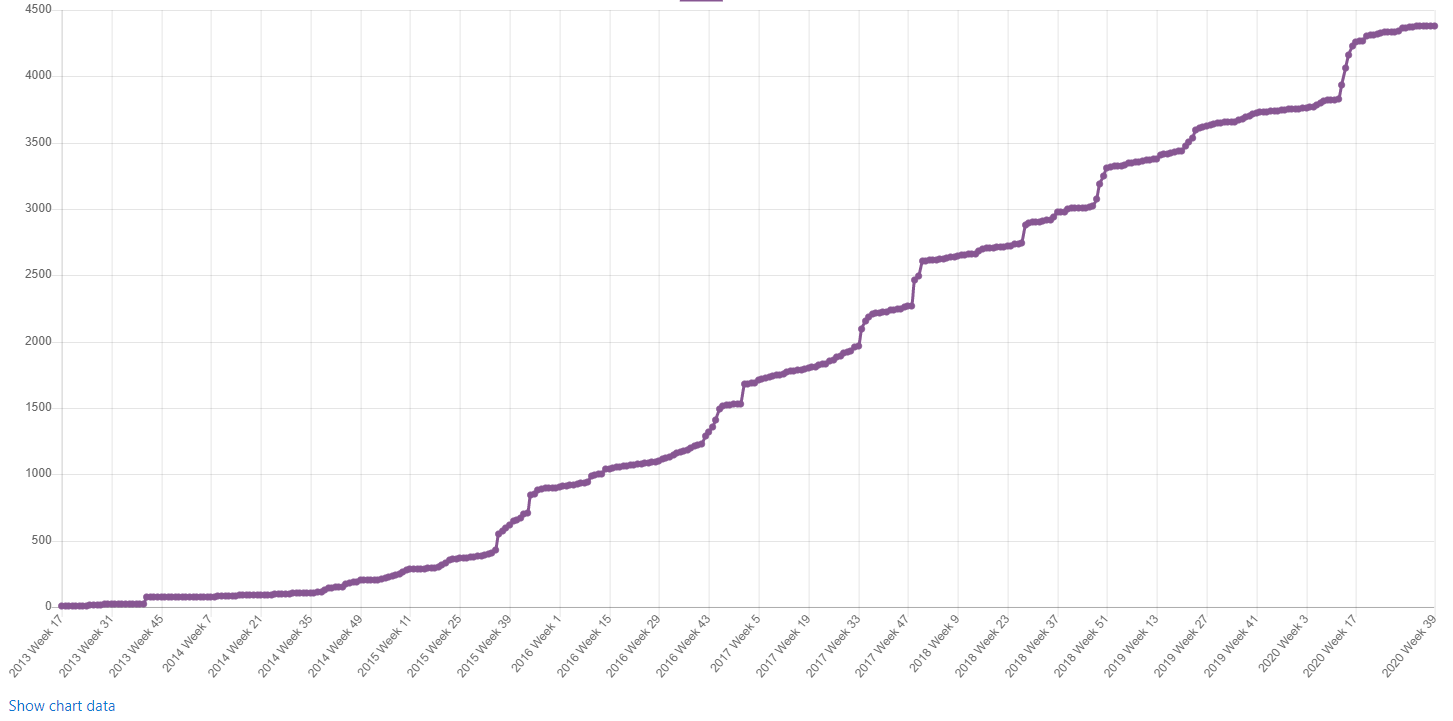
This is a report for managers and marketeers: in their life everything can only grow and never shrink. So the first graph always shows a growing curve based on the total number of activities - users - certificates, ....
The second graph is more interesting: there the number of new activities - users - certificates, .... per quarter is shown.
You are welcome to create a pull request to add a precise description of the displayed data (what it is, and what it's not). But I have the impression this info will be very repetitive. And my experience is that managers and marketeers are not the reading type....
R
Growth plugin is nice and useful.
A suggestion : would it be possible, on each report page, to add a precise description of the displayed data (what it is, and what it's not), so that it's clear for people looking at it (to understand the underlying query and corresponding values).
This report does not store information but collects information from tables without even checking if the data is visible or not. So hiding a course will not have a difference in the report, nor moving the course in an archived category. Deleting a course removes the activity completion data, but strangely not the the course completion data.
So making a recommendation is difficult. it all depends on your privacy and/or site policy what happens with old data. This plugin can only show data that is not deleted...
If a course is deleted, will its completions still show up? If not, so you recommend hiding the course and moving it to an archived category instead?
Currently, there is no way to go in depth, nor can the dates be filtered, simply because the managers I know are not interested in details, they only want numbers that go up
But if you find a budget, this could be implemented.
R
Two questions, is there a way to go in depth in each point of the graph? how could one filter the dates of the graphs?
Thank you very much!
this function does not exist for the simple reason that city and state are text fields. As an example, I have seen hundreds of versions of the city 'Perth', Pert - Perht - Parth - ...., so this plugin would only produce unreliable results....
R
Thank for the reply.
Have a nice weekend!
I divide a year in 4 parts: Quarter ! - Quarter 2 | Quarter 3 | Quarter 4.
R
I like this plugin, but I would like to know if you can clarify what Q1, Q2, Q3 and Q4 mean in the graphs.
Thanks greetings.
It is the same information that is sent to Moodle each time your site registration is updated (Site administration > Registration). The calculation is a simple database query:
activeusers = $DB->count_records_select('user', 'deleted = ? AND lastlogin > ?', [0, time() - DAYSECS * 30])
So for Moodle, the last 30 days is considered as recent.
R.