Travis Wilhelm
Lead maintainer

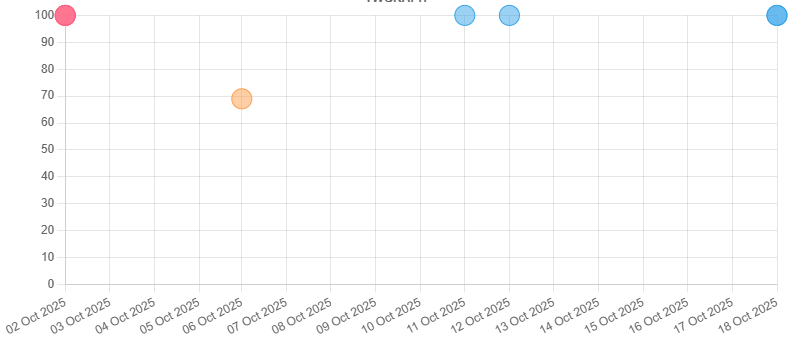
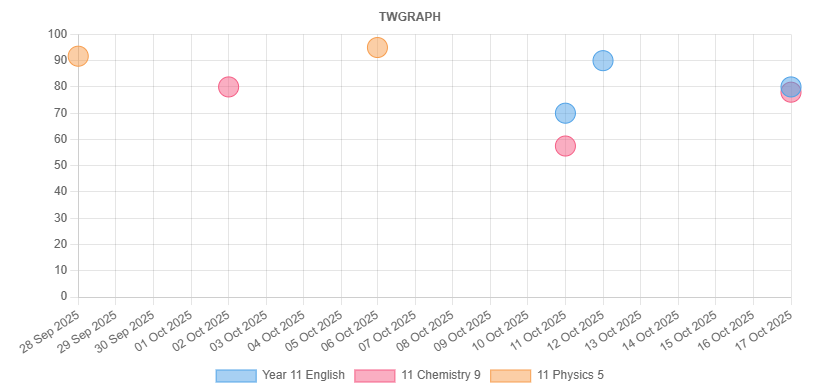
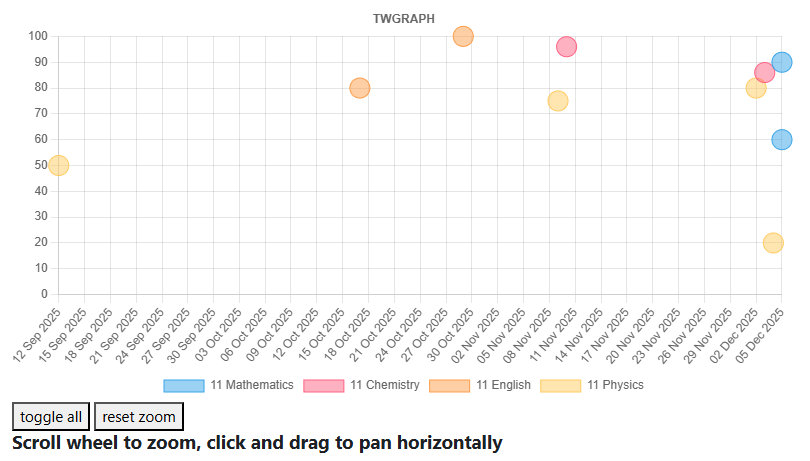
Visualise your student results across time to see trends and analyse the grades.
TWGraph_Lite is a Moodle report plugin to display all assignment grades for a user on a graph, enabling zoom, filtering by course and scrolling.
Adds a report on user profile, to display the graph.
A Full Featured Product (TWGraph), including weightings, averages, trends and summary information available for purchase here: https://traviswilhelm.com.au/twgraph-moodle-plugin/
Note: Unless you are a 'manager', by default you will only be able to view your own graph, since the graph shows data from other courses that the student is in. However, if this is allowed in your context, use the 'course creator' role (or a new one) and set the permissions within this role to allow those users to view results from other courses (view other users graphs).
