Server Monitor (block_servermon)
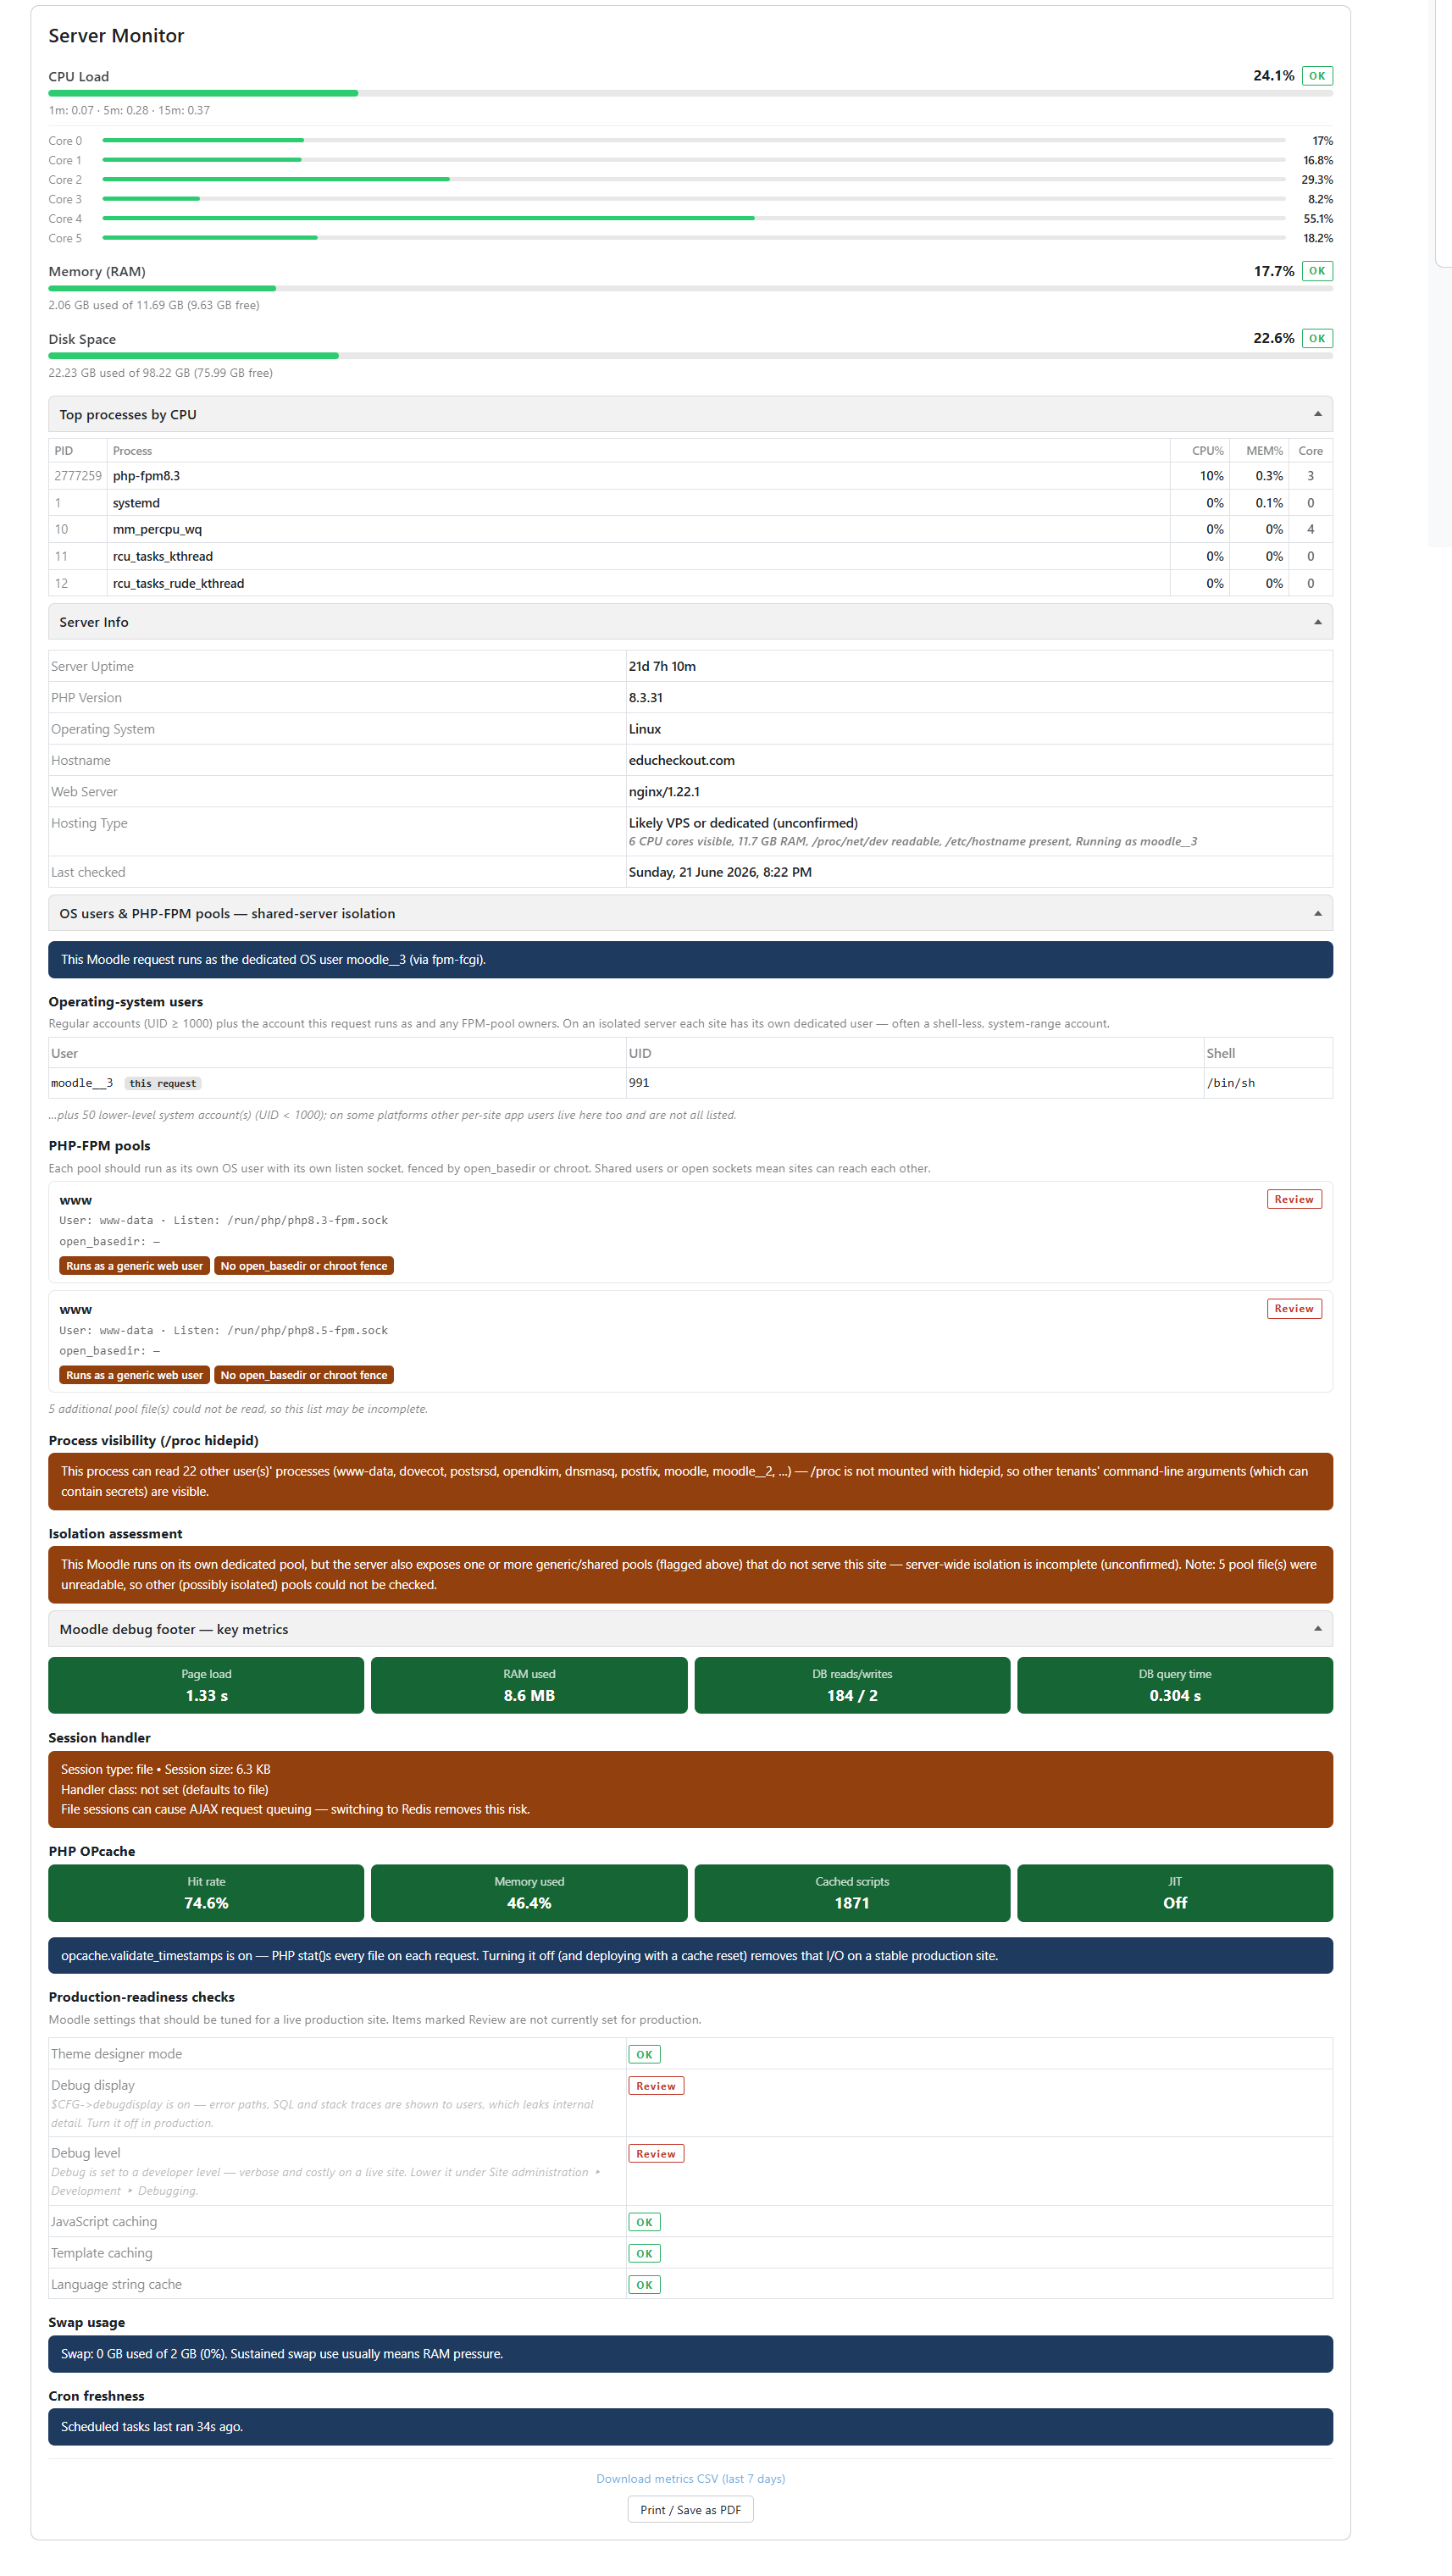
A Moodle dashboard block that gives site administrators an at-a-glance view of server health — CPU, memory and disk usage, top processes, Moodle performance metrics, and a shared-hosting isolation audit — without leaving the Moodle interface.
The block is visible to site administrators only. All data is read live on each page load (plus a lightweight 5-minute logging task); no personal data is collected.
What it shows
- Resource gauges — Three colour-coded bars for CPU load, RAM (/proc/meminfo) and disk space, each shown as used/free/total. CPU includes a per-core breakdown and 1m/5m/15m load averages. Colours: 🟢 green below 60%, 🟡 amber 60–80%, 🔴 red above 80%.
- Top processes by CPU — A collapsible live table (PID, process, CPU%, MEM%, last CPU core) that polls every 5 seconds while open and stops when collapsed. Reads /proc/[pid]/stat directly, falling back to ps where permitted.
- Server info panel — Uptime, PHP version, OS, hostname, web server, a best-effort hosting-type estimate, and the last-checked timestamp.
- Shared-server isolation audit — For multi-tenant hosts, confirms whether each site runs under its own OS user and PHP-FPM pool, fenced by open_basedir/chroot and a private socket. It flags the account this Moodle request runs as, scans FPM pool configs, checks /proc hidepid visibility, and gives an overall verdict (Good / Partial / Weak / Single / Incomplete / Unknown). This is a configuration audit, not a live security guarantee.
- Moodle debug footer — key metrics — Page time, peak memory, DB reads/writes and query time, session handler details (including Redis connection and sharing/security signals), OPcache health, production-readiness checks, swap usage, cron freshness, and MUC cache-store performance.
- Metric logging & CSV export — A scheduled task (collect_metrics) records per-core CPU%, RAM% and disk% every 5 minutes to block_servermon_log. A Download metrics CSV (last 7 days) link appears once records exist.
- Print / Save as PDF — A client-side print button that expands the collapsible panels, applies a print stylesheet, and outputs just the block with a header line (plugin name, hostname, timestamp).
Configuration
Site Administration ' Plugins ' Blocks ' Server Monitor
| Setting |
Default |
Description |
| Disk path |
/ |
Filesystem path used for disk reporting. Point this at your data mount (e.g. /data) if moodledata is on a separate partition. This also applies to the logging task. |
Privacy
No personal data is collected. The log table stores only server-level metrics (CPU%, RAM%, disk%) with a timestamp — no usernames, IP addresses or session identifiers. The isolation panel reads OS-level configuration live and stores none of it. The Moodle privacy API null provider is implemented.