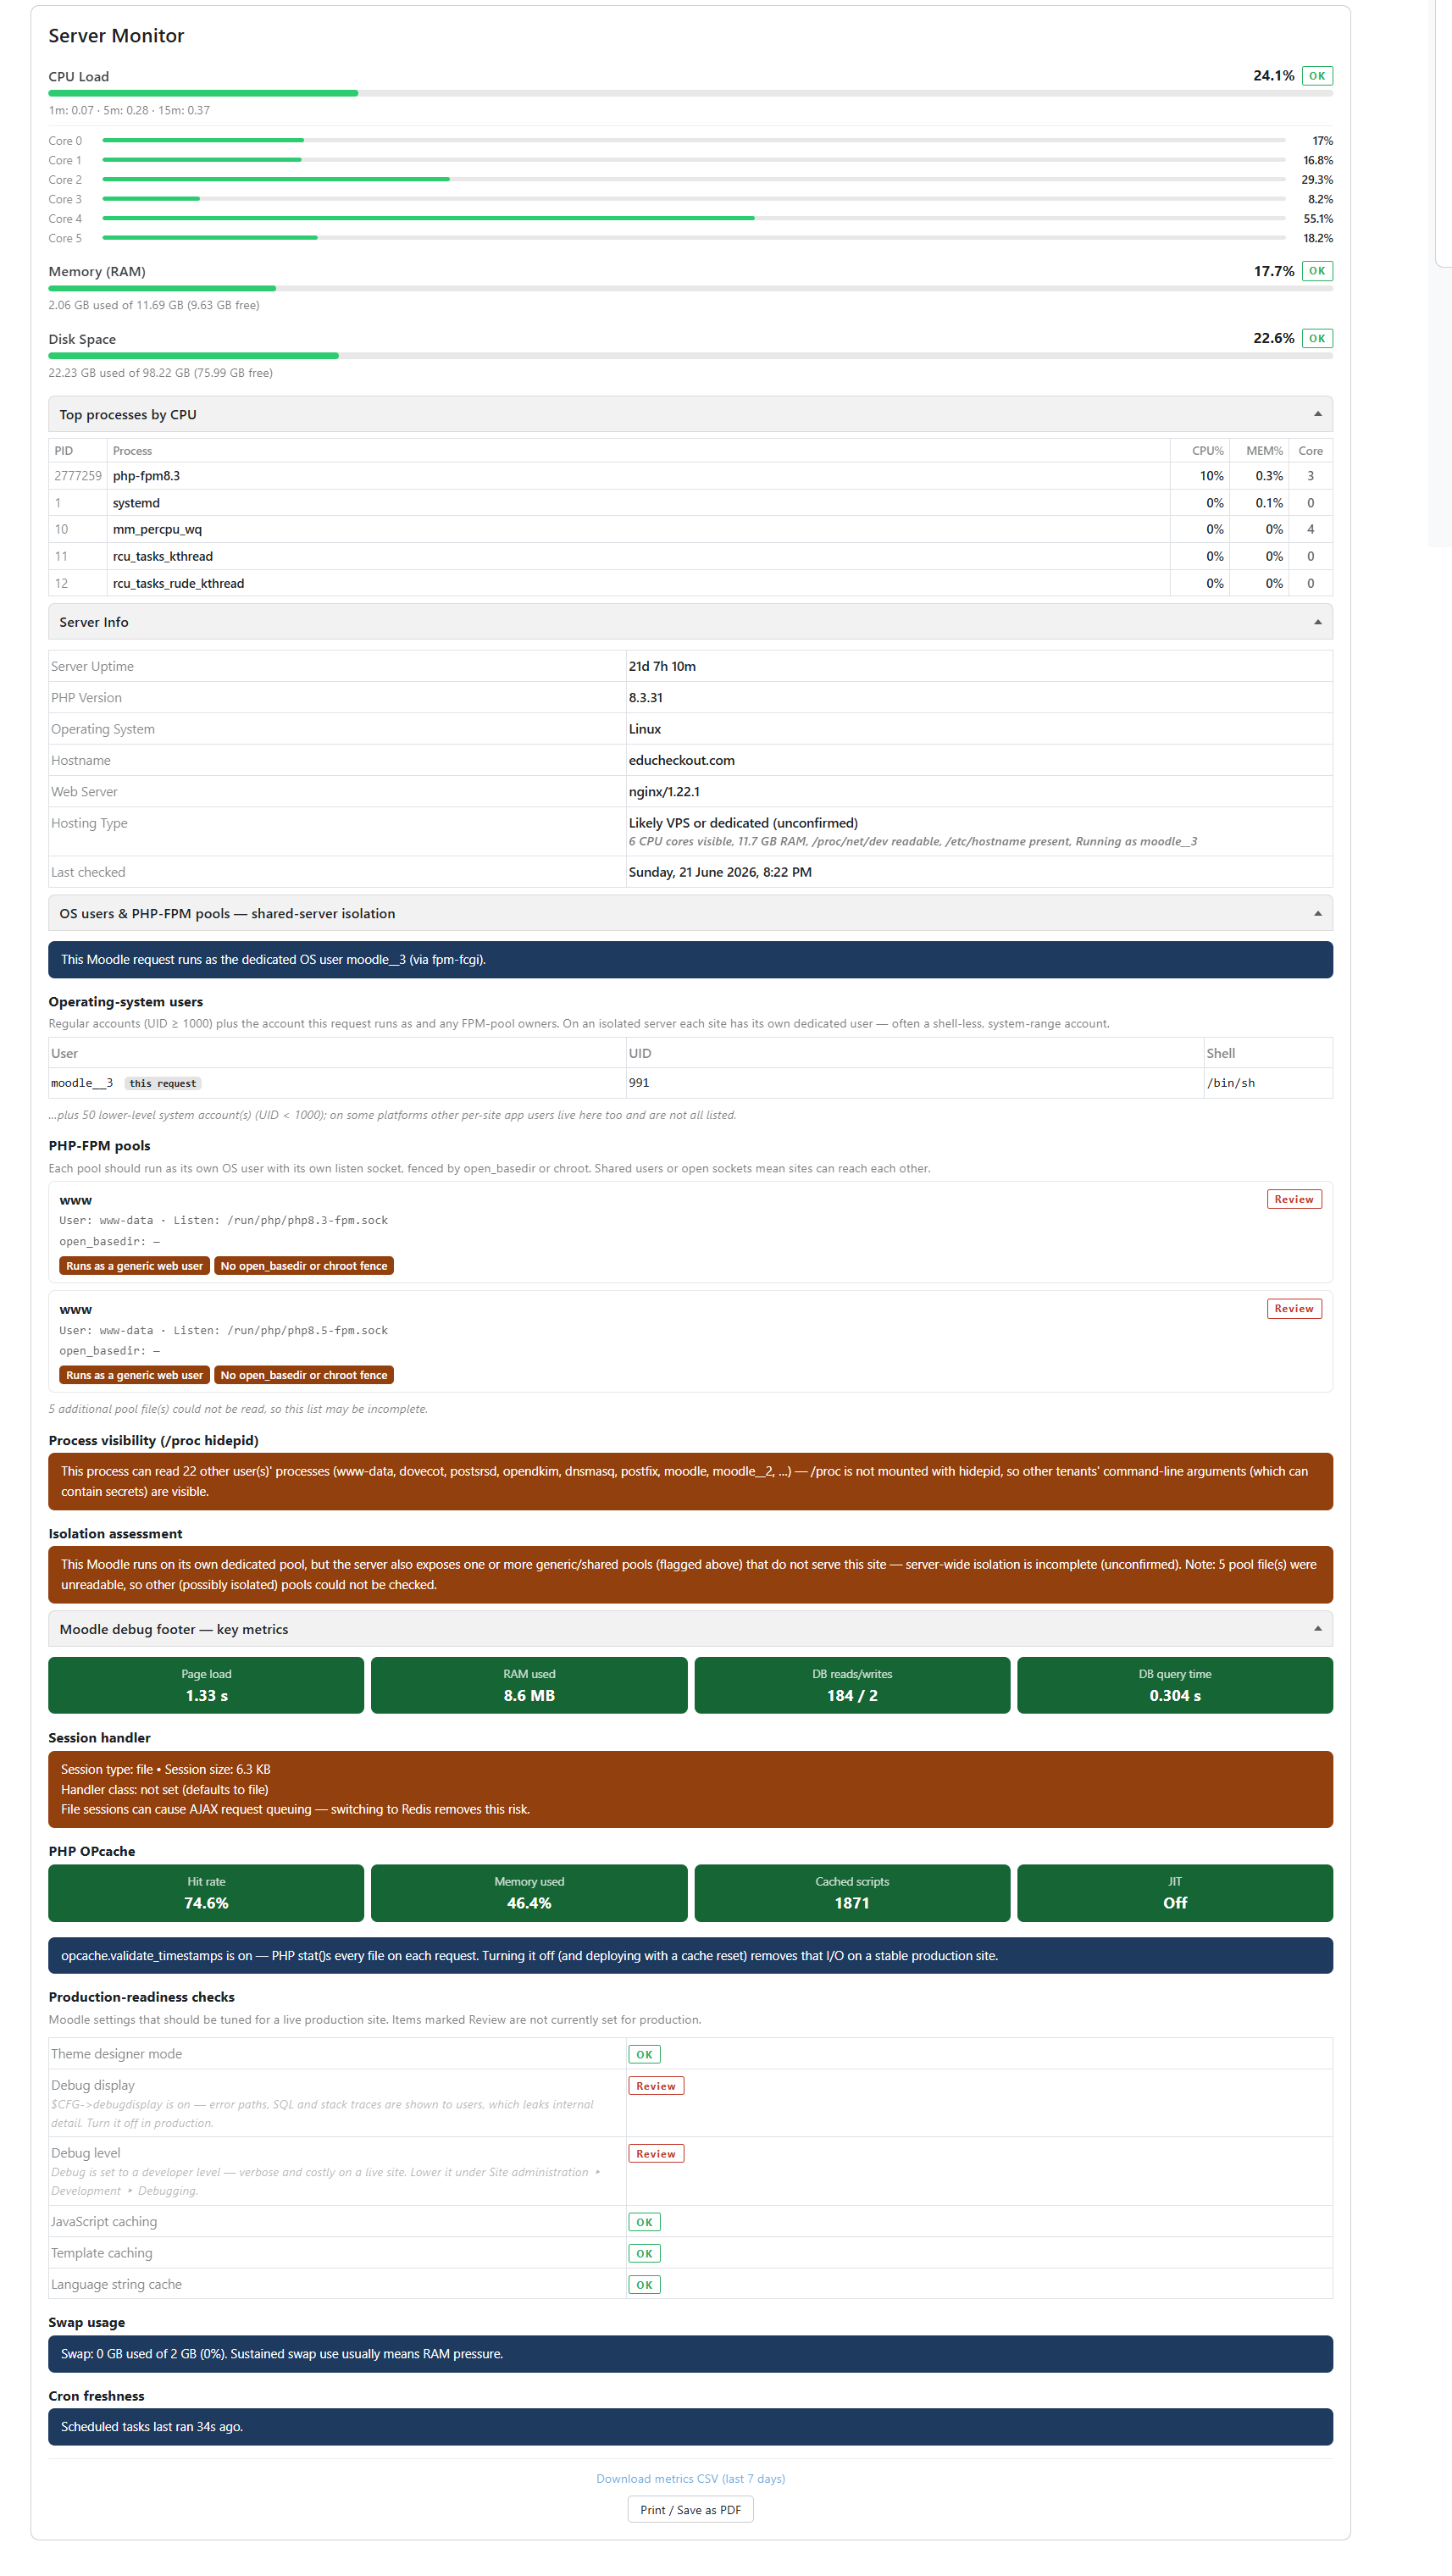
Server Monitor
Versions
Current version
1.9.1 (2026062100)
1.9.1
Plugin type: Blocks
Frankenstyle component name: block_servermon
Version build number: 2026062100
Version release name: 1.9.1
Maturity: Stable
Supported Moodle versions: 5.0, 5.1, 5.2
Repository URL (Git): https://github.com/verzog/block_servermon
Repository branch: main
Repository tag: v1.9.1
Issue/bug tracker URL: https://github.com/verzog/block_servermon/issues
Changelog
All notable changes to block_servermon are documented in this file.
The format is based on Keep a Changelog,
and this project adheres to Semantic Versioning.
[1.9.1] - 2026-06-21
Fixed
- Session handler diagnostic now resolves the effective handler the way
core's\core\session\managerdoes: when$CFG->session_handler_classis
unset, the panel reports database sessions if$CFG->dbsessionsis enabled
(and the DB supports session locking), otherwise file. This stops a
database-session site being mislabelled "defaults to file" and falsely raising
the Redis-inactive / file-session warning. - Process-visibility (
/prochidepid) no longer trustsgetmyuid()(which
returns the script file owner, not the worker's effective UID) — the check is
skipped when the POSIX extension can't supply a true effective UID, rather than
comparing against the wrong identity. - Process-visibility distinguishes "no other-user processes were running" from
"foreign processes exist but are hidden", so a host with nothing to sample no
longer receives a falsehidepid-hardened signal. Thehidepidlevel is read
from the/procmount options so a hardenedhidepid=2mount (which hides
foreign/proc/[pid]dirs from the listing) is still recognised as hardened. - PHP-FPM pool audit treats an unresolvable OS account (no readable
/etc/passwdand noposix_getpwnam()) as an undetermined/incomplete result
instead of a hard "user not found" failure that downgraded the verdict to Weak. - Isolation verdict no longer returns the site-centric Partial ("on its own
dedicated pool") result when another pool's config is undetermined (e.g. user set
in aninclude) and the current request's pool was not positively matched as
clean — such hosts now report Incomplete.
1.9.0 - 2026-06-18
Added
- Redis sharing & security signals in the session panel, derived from
config.phpalone (no live connection): warns on an empty
session_redis_prefix(shared-instance key collision risk), a non-loopback
host, and a missingsession_redis_authon an off-box host. - PHP OPcache health section: hit rate, memory used, cached scripts and JIT
status, with advisories for out-of-memory restarts, near-full key slots and
opcache.validate_timestamps; warns when OPcache is installed but disabled. - Production-readiness checks:
themedesignermode,debugdisplay,debug
level, andcachejs/cachetemplates/langstringcacheeach flagged
OK or Review with a remediation note. - Server health section: swap usage from
/proc/meminfo(warns above 25%)
and cron freshness, including an explicit warning when no scheduled task has
ever run and a count of currently failing tasks.
Changed
- Improved Redis session detection: surface the active handler class and flag
the "Redis configured but sessions still file-based" misconfiguration and a
missingredisPHP extension. - Restyled the collapsible sections (Top processes, Server Info, OS users &
PHP-FPM pools, Moodle debug footer) as full-width toggle bars with a
rotating CSS chevron, and unified all four to a single consistent style.
Fixed
- Production-readiness control-structure spacing flagged by phpcs
(PSR12.ControlStructures.ControlStructureSpacing).
1.8.1 - 2026-06-15
- Earlier maintenance release. See the Git history for details.
1.9.0 (2026061702)
1.9.0
Plugin type: Blocks
Frankenstyle component name: block_servermon
Version build number: 2026061702
Version release name: 1.9.0
Maturity: Stable
Supported Moodle versions: 5.0, 5.1, 5.2
Repository URL (Git): https://github.com/verzog/moodle-block_servermon.git
Repository branch: main
Repository tag: v1.9.0
Issue/bug tracker URL: https://github.com/verzog/block_servermon/issues
Changelog
All notable changes to block_servermon are documented in this file.
The format is based on Keep a Changelog,
and this project adheres to Semantic Versioning.
1.9.0 - 2026-06-18
Added
- Redis sharing & security signals in the session panel, derived from
config.phpalone (no live connection): warns on an empty
session_redis_prefix(shared-instance key collision risk), a non-loopback
host, and a missingsession_redis_authon an off-box host. - PHP OPcache health section: hit rate, memory used, cached scripts and JIT
status, with advisories for out-of-memory restarts, near-full key slots and
opcache.validate_timestamps; warns when OPcache is installed but disabled. - Production-readiness checks:
themedesignermode,debugdisplay,debug
level, andcachejs/cachetemplates/langstringcacheeach flagged
OK or Review with a remediation note. - Server health section: swap usage from
/proc/meminfo(warns above 25%)
and cron freshness, including an explicit warning when no scheduled task has
ever run and a count of currently failing tasks.
Changed
- Improved Redis session detection: surface the active handler class and flag
the "Redis configured but sessions still file-based" misconfiguration and a
missingredisPHP extension. - Restyled the collapsible sections (Top processes, Server Info, OS users &
PHP-FPM pools, Moodle debug footer) as full-width toggle bars with a
rotating CSS chevron, and unified all four to a single consistent style.
Fixed
- Production-readiness control-structure spacing flagged by phpcs
(PSR12.ControlStructures.ControlStructureSpacing).
1.8.1 - 2026-06-15
- Earlier maintenance release. See the Git history for details.
1.8.1 (2026061505)
1.8.1
Plugin type: Blocks
Frankenstyle component name: block_servermon
Version build number: 2026061505
Version release name: 1.8.1
Maturity: Stable
Supported Moodle versions: 5.0, 5.1, 5.2
Repository URL (Git): https://github.com/verzog/moodle-block_servermon
Repository branch:
Repository tag: v1.8.1
Issue/bug tracker URL: https://github.com/verzog/block_servermon/issues
What's new in 1.8.1
Shared-server isolation audit (new)
A collapsible panel that checks whether a multi-tenant server isolates each site:
- OS users — per-site accounts from
/etc/passwd, including system-range
(nologin) app users as used by YunoHost/Plesk/cPanel; the current request's
user and FPM-pool owners are tagged. - PHP-FPM pools — each pool shown with its user/group, listen socket and
hardening directives (open_basedir,chroot, socket mode), flagged for
generic/shared/root users, world-writable sockets, shared homes, etc. - Process visibility — detects when
/proclackshidepid, meaning other
tenants' processes and command-line arguments are visible. - A best-effort, site-centric isolation verdict (always marked unconfirmed).
Print / Save as PDF (new)
A button that prints just the block (browser "Save as PDF"), with colours
preserved and the rest of the dashboard removed from the printout.
Notes
- Linux-only features degrade gracefully; admin-only; no personal data stored.
- Requires Moodle 5.0+ and PHP 8.2+.
1.3.0 (2026040200)
1.3.0
Plugin type: Blocks
Frankenstyle component name: block_servermon
Version build number: 2026040200
Version release name: 1.3.0
Maturity: Stable
Supported Moodle versions: 4.5, 5.0, 5.1
Repository URL (Git): https://github.com/verzog/block_servermon
Repository branch:
Repository tag:
Issue/bug tracker URL: https://github.com/verzog/block_servermon/issues
Server Monitor Block for Moodle (block_servermon)
A lightweight Moodle block that displays live server health metrics on the admin Dashboard. Covers CPU, RAM, disk, top processes, Moodle page-performance metrics, cache store health, session info, and historical metric logging with CSV export.
Requirements
- Moodle 4.5 or higher
- PHP 8.1 or higher
- Linux-based server recommended (Windows Server is supported but most metrics will show as unavailable)
- Site administrator role to view the block
Installation
- Download
block_servermon.zip - In Moodle, go to Site Administration ' Plugins ' Install plugins
- Upload the zip file and click Install plugin from the ZIP file
- Follow the on-screen confirmation steps
- Go to your Dashboard, turn editing on, click Add a block, and select Server Monitor
Alternatively, unzip the file and copy the servermon folder to /blocks/ on your server, then visit Site Administration ' Notifications to complete the install.
What It Shows
Resource Gauges
Three colour-coded progress bars are shown at the top of the block:
| Metric | Source | Notes |
|---|---|---|
| CPU Load | /proc/stat (two-sample delta, 500 ms) | Aggregate CPU% plus per-core breakdown bars; 1m/5m/15m load averages shown below |
| Memory (RAM) | /proc/meminfo | Used/free/total in GB |
| Disk Space | disk_total_space(), disk_free_space() | Used/free/total in GB for the configured mount point (default /) |
Status colours
| Colour | Meaning | Threshold |
|---|---|---|
| 🟢 Green | OK | Below 60% |
| 🟡 Amber | Moderate | 60–80% |
| 🔴 Red | High | Above 80% |
Top Processes by CPU
Collapsed by default. Click Top processes by CPU - to expand.
Once open, the panel polls the server every 5 seconds via a lightweight AJAX request and renders a live table:
| Column | Description |
|---|---|
| PID | Process ID |
| Process | Command name (truncated to 15 chars by the kernel) |
| CPU% | CPU usage over the last ~200 ms sample window |
| MEM% | Resident set size as a percentage of total RAM |
The poll stops automatically when you collapse the panel to avoid unnecessary background requests.
How it works: The AJAX endpoint (process.php) reads all /proc/[pid]/stat files twice with a 200 ms gap and calculates per-process CPU% from the tick delta, mirroring what ps does internally. On servers where /proc is unavailable, it falls back to ps aux --sort=-%cpu via shell_exec() if that function is permitted.
Server Info Panel
Collapsed by default. Click Server Info - to expand. Contains:
| Field | Description |
|---|---|
| Server Uptime | How long the server has been running since last reboot, read from /proc/uptime |
| PHP Version | The PHP version Moodle is currently running on |
| OS | The OS platform string (PHP_OS) |
| Hostname | The server's hostname as returned by gethostname() |
| Web Server | The web server software (e.g. Apache, Nginx), read from $_SERVER['SERVER_SOFTWARE'] |
| Hosting Type | A heuristic estimate of the hosting environment (see below) |
| Last Checked | The timestamp when the block last rendered — data is live on each page load |
Moodle Debug Footer — Key Metrics
Collapsed by default. Click Moodle debug footer — key metrics - to expand. Shows Moodle page-performance data for the current request:
Summary cards
| Card | Description |
|---|---|
| Page Time | Seconds elapsed since REQUEST_TIME_FLOAT |
| Peak Memory | PHP peak memory usage for this request (MB) |
| DB Reads / Writes | Number of SELECT and write queries issued by Moodle on this page load |
| DB Query Time | Total time spent in database queries (seconds) |
Session handler
Shows the active session backend type (file, Redis, Memcached, or database), the serialised size of the current session, and lock wait time. If Redis is detected, the full connection configuration is displayed:
- Host, port, database index
- Key prefix
- Lock timeout and lock expiry settings
A warning is shown if the file-based session handler is in use, as this can become a bottleneck under load.
Cache store performance
Shows hit/miss counts and I/O bytes across the four MUC cache modes:
| Row | Description |
|---|---|
| Static cache | In-process PHP static cache |
| Application cache | Persistent store (Redis, APCu, or file) |
| Session cache | Per-session store |
| Request cache | Single-request in-memory store |
If the application cache miss rate exceeds 50% and the store is file-based, an advisory note suggests adding Redis or APCu.
Metric Logging & CSV Export
The block records server metrics once per minute to a lightweight database table (block_servermon_log). A Download metrics CSV (last 7 days) link appears at the bottom of the block when log records exist.
What is logged
| Column | Description |
|---|---|
| timestamp | UTC time of the sample |
| cpu_core0_pct … cpu_coreN_pct | Per-core CPU% (one column per physical core) |
| ram_pct | RAM used as a percentage of total |
| disk_pct | Disk used as a percentage of total (for the configured disk path) |
The CSV includes a UTF-8 BOM for clean opening in Microsoft Excel.
Scheduled task
A scheduled task (collect_metrics) runs every minute to write samples independently of page loads. It uses the same /proc/stat sampling logic as the live block display.
Admin Settings
Go to Site Administration ' Plugins ' Blocks ' Server Monitor to configure:
| Setting | Default | Description |
|---|---|---|
| Disk path | / | The filesystem path used for disk space reporting. Set this to your data mount point (e.g. /data) if your Moodle moodledata directory is on a separate partition. |
This setting also applies to the scheduled task so that logged disk metrics reflect the same mount point shown in the block.
Hosting Type Detection
The block attempts to classify the server environment using a six-layer detection system. This is a best-effort heuristic only — results should be treated as an informed guess rather than a confirmed fact.
Detection layers (in priority order)
Layer 1 — Control panel / platform fingerprints
| Platform | Files/dirs checked | Label shown |
|---|---|---|
| YunoHost | /etc/yunohost/, /usr/share/yunohost/ | YunoHost / Self-hosted VPS |
| Plesk | /etc/plesk/, /usr/local/psa/version | VPS or Dedicated with Plesk |
| cPanel | /usr/local/cpanel/, /etc/cpanel/cpanel.config | Shared or VPS with cPanel |
| DirectAdmin | /etc/directadmin/directadmin.conf | Shared or VPS with DirectAdmin |
| Webmin/Virtualmin | /etc/webmin/, /usr/share/webmin/version | Self-managed Server with Webmin |
| ISPConfig | /usr/local/ispconfig/ | Shared or VPS with ISPConfig |
| HestiaCP / VestaCP | /usr/local/hestia/, /usr/local/vesta/ | VPS with HestiaCP/VestaCP |
| CentOS Web Panel | /usr/local/cwpsrv/ | VPS with CWP |
| Parallels/Virtuozzo | /opt/psa/ | Shared or VPS with Parallels |
Layer 2 — Cloud provider detection
Reads /sys/class/dmi/id/sys_vendor to identify the cloud host directly.
| Provider detected |
|---|
| AWS, Azure, Google Cloud, DigitalOcean, Hetzner, Contabo, Vultr, Linode/Akamai, OVH |
Layer 3 — Virtualisation type
Reads /sys/class/dmi/id/product_name and /proc/cpuinfo hypervisor flags.
| Detected | Notes |
|---|---|
| KVM | Used by Contabo, DigitalOcean, Vultr, Linode |
| VMware | VMware ESXi environments |
| VirtualBox | Local development machines |
| QEMU/KVM | QEMU-based hypervisors |
| Xen | AWS older instances, some dedicated providers |
| Hyper-V | Microsoft Azure, Windows Server hosts |
| Container (LXC/Docker) | Detected via /proc/1/environ |
Layer 4 — Bare-metal chassis detection
Reads /sys/class/dmi/id/chassis_type. Chassis codes 17 (Rack Mount), 23 (Blade), and 24 (Blade Enclosure) indicate physical dedicated hardware.
Layer 5 — OS fingerprint
Reads /etc/os-release, /etc/debian_version, or /etc/redhat-release for the Linux distribution name and version.
Layer 6 — Resource-based scoring (final fallback)
Only used if no label was set by layers 1–4. Scores based on CPU count, RAM, /proc/net/dev readability, and PHP process username.
| Score | Label |
|---|---|
| 3+ | Likely Dedicated Server |
| 1–2 | Likely VPS or Shared Hosting |
| 0 | Likely Shared Hosting |
Limitations
Metrics that cannot be shown
The following are not available via SQL or PHP and therefore cannot be shown by this block:
- Network I/O (bandwidth in/out)
- GPU usage
- Temperature sensors
Hosting restrictions
Some shared hosting providers restrict access to /proc/meminfo, /proc/cpuinfo, or sys_getloadavg(). If your host blocks these, the affected metrics will display as Unavailable. This is a hosting-level restriction and cannot be worked around from within a Moodle plugin.
Visibility & Security
- The block content is only rendered for site administrators. Any other user who somehow has the block on their dashboard will see nothing.
- The AJAX process endpoint (
process.php) and the CSV export endpoint (export.php) both require themoodle/site:configcapability and will return an error for any other user. - No personal data is collected or stored (see Privacy section below).
Privacy
This block collects no personal data. The metric log table records only server-level OS metrics (CPU%, RAM%, disk%) with a timestamp. No usernames, IP addresses, or session identifiers are stored. The Moodle privacy API null provider is implemented accordingly.
Compatibility
| Component | Requirement |
|---|---|
| Moodle | 4.5+ |
| PHP | 8.1+ |
| Database | MySQL, MariaDB, PostgreSQL |
| OS | Linux (full support), Windows Server (gauges unavailable) |
| Theme | Any Moodle theme |
Frequently Asked Questions
The CPU/RAM/Disk shows "Unavailable" — is the plugin broken?
No. Your hosting provider has restricted access to the OS-level files the block reads from. This is common on shared hosting. The block itself is working correctly.
The Top Processes panel is empty.
Either /proc is not readable (restricted hosting) or shell_exec() is disabled. Both are hosting-level restrictions. The block will show "No process data available" rather than an error.
The CPU% shows over 100%.
The block displays aggregate CPU% across all cores from a /proc/stat two-sample delta, so 100% is the maximum. If you see very high values, check the per-core breakdown bars below the main CPU bar — one or more cores may be fully saturated.
The disk space looks wrong.
If your Moodle data directory is on a separate partition (e.g. /data), configure the Disk path setting under Site Administration ' Plugins ' Blocks ' Server Monitor to point to that mount point.
Why does the Hosting Type say "unconfirmed"?
Because it genuinely cannot be confirmed from within PHP alone. The label is a heuristic estimate. See the Hosting Type Detection section for full details.
Can I add this block to pages other than the Dashboard?
No — the block is restricted to My Dashboard (applicable_formats) by design. This keeps sensitive server information away from course pages.
Will this slow down my Moodle site?
Minimally. The main block render reads from OS memory-mapped files and runs a 500 ms CPU sample. The process panel only polls when open. Metric logging is rate-limited to once per minute and runs via a scheduled task. No expensive queries are performed.
License
GNU General Public License v3 or later
http://www.gnu.org/copyleft/gpl.html
1.1.2 (2026032909)
1.1.2
Plugin type: Blocks
Frankenstyle component name: block_servermon
Version build number: 2026032909
Version release name: 1.1.2
Maturity: Stable
Supported Moodle versions: 5.0, 5.1
Repository URL (Git): https://github.com/verzog/block_servermon
Repository branch:
Repository tag:
Issue/bug tracker URL: https://github.com/verzog/block_servermon/issues
Server Monitor Block for Moodle (block_servermon)
A lightweight Moodle block that displays live server health metrics on the admin Dashboard. Designed as a simple open-source alternative to plugins like Edwiser Site Monitor.
Requirements
- Moodle 5.0 or higher
- PHP 8.1 or higher
- Linux-based server recommended (Windows Server is supported but most metrics will show as unavailable)
- Site administrator role to view the block
Installation
- Download
block_servermon.zip - In Moodle, go to Site Administration ' Plugins ' Install plugins
- Upload the zip file and click Install plugin from the ZIP file
- Follow the on-screen confirmation steps
- Go to your Dashboard, turn editing on, click Add a block, and select Server Monitor
Alternatively, unzip the file and copy the servermon folder to /blocks/ on your server, then visit Site Administration ' Notifications to complete the install.
What It Shows
Resource Gauges
Three colour-coded progress bars are shown at the top of the block:
| Metric | Source | Notes |
|---|---|---|
| CPU Load | /proc/cpuinfo, sys_getloadavg() | Shows current load as % of total CPU capacity, plus 1m/5m/15m load averages |
| Memory (RAM) | /proc/meminfo | Shows used/free/total in GB |
| Disk Space | disk_total_space(), disk_free_space() | Shows used/free/total in GB for the root partition |
Status colours
| Colour | Meaning | Threshold |
|---|---|---|
| 🟢 Green | OK | Below 60% |
| 🟡 Amber | Moderate | 60–80% |
| 🔴 Red | High | Above 80% |
Server Info Panel
Collapsed by default. Click Server Info - to expand. Contains:
| Field | Description |
|---|---|
| Server Uptime | How long the server has been running since last reboot, read from /proc/uptime |
| PHP Version | The PHP version Moodle is currently running on |
| Database | Database engine family and version, read from Moodle's $DB object (e.g. PostgreSQL 15.4, MySQL 8.0.32) |
| Hostname | The server's hostname as returned by gethostname() |
| Web Server | The web server software (e.g. Apache, Nginx), read from $_SERVER['SERVER_SOFTWARE'] |
| Hosting Type | A heuristic estimate of the hosting environment (see below) |
| Last Checked | The timestamp when the block last rendered — data is live on each page load |
Hosting Type Detection
The block attempts to classify the server environment using a six-layer detection system. This is a best-effort heuristic only — results should be treated as an informed guess rather than a confirmed fact.
Detection layers (in priority order)
Layer 1 — Control panel / platform fingerprints
| Platform | Files/dirs checked | Label shown |
|---|---|---|
| YunoHost | /etc/yunohost/, /usr/share/yunohost/ | YunoHost / Self-hosted VPS |
| Plesk | /etc/plesk/, /usr/local/psa/version | VPS or Dedicated with Plesk |
| cPanel | /usr/local/cpanel/, /etc/cpanel/cpanel.config | Shared or VPS with cPanel |
| DirectAdmin | /etc/directadmin/directadmin.conf | Shared or VPS with DirectAdmin |
| Webmin/Virtualmin | /etc/webmin/, /usr/share/webmin/version | Self-managed Server with Webmin |
| ISPConfig | /usr/local/ispconfig/ | Shared or VPS with ISPConfig |
| HestiaCP / VestaCP | /usr/local/hestia/, /usr/local/vesta/ | VPS with HestiaCP/VestaCP |
| CentOS Web Panel | /usr/local/cwpsrv/ | VPS with CWP |
| Parallels/Virtuozzo | /opt/psa/ | Shared or VPS with Parallels |
Layer 2 — Cloud provider detection
Reads /sys/class/dmi/id/sys_vendor to identify the cloud host directly.
| Provider detected |
|---|
| AWS, Azure, Google Cloud, DigitalOcean, Hetzner, Contabo, Vultr, Linode/Akamai, OVH |
Layer 3 — Virtualisation type
Reads /sys/class/dmi/id/product_name and /proc/cpuinfo hypervisor flags.
| Detected | Notes |
|---|---|
| KVM | Used by Contabo, DigitalOcean, Vultr, Linode |
| VMware | VMware ESXi environments |
| VirtualBox | Local development machines |
| QEMU/KVM | QEMU-based hypervisors |
| Xen | AWS older instances, some dedicated providers |
| Hyper-V | Microsoft Azure, Windows Server hosts |
| Container (LXC/Docker) | Detected via /proc/1/environ |
Layer 4 — Bare-metal chassis detection
Reads /sys/class/dmi/id/chassis_type. Chassis codes 17 (Rack Mount), 23 (Blade), and 24 (Blade Enclosure) indicate physical dedicated hardware.
Layer 5 — OS fingerprint
Reads /etc/os-release, /etc/debian_version, or /etc/redhat-release for the Linux distribution name and version. Shown as a signal detail only (e.g. Debian GNU/Linux 12 (bookworm)).
Layer 6 — Resource-based scoring (final fallback)
Only used if no label was set by layers 1–4. Scores based on CPU count, RAM, /proc/net/dev readability, and PHP process username.
| Score | Label |
|---|---|
| 3+ | Likely Dedicated Server |
| 1–2 | Likely VPS or Shared Hosting |
| 0 | Likely Shared Hosting |
Limitations
Metrics that cannot be shown
The following are not available via SQL or PHP and therefore cannot be shown by this block:
- Network I/O (bandwidth in/out)
- Per-process CPU breakdown
- GPU usage
- Temperature sensors
Hosting restrictions
Some shared hosting providers restrict access to /proc/meminfo, /proc/cpuinfo, or sys_getloadavg(). If your host blocks these, the affected metrics will display as Unavailable. This is a hosting-level restriction and cannot be worked around from within a Moodle plugin.
Data is not historical
The block reads live values at the moment the Dashboard page loads. It does not store historical data or generate graphs over time. For historical monitoring, consider a dedicated server monitoring tool such as Netdata, Munin, or Glances.
Visibility & Security
- The block content is only rendered for site administrators. Any other user who somehow has the block on their dashboard will see nothing.
- No data is written to the Moodle database by this block.
- No personal data is collected or stored (see Privacy section below).
Privacy
This block stores no personal data of any kind. It reads server-level OS metrics only. The Moodle privacy API null provider is implemented accordingly.
Compatibility
| Component | Requirement |
|---|---|
| Moodle | 5.0+ |
| PHP | 8.1+ |
| Database | MySQL, MariaDB, PostgreSQL (block does not query the DB directly) |
| OS | Linux (full support), Windows Server (partial — gauges unavailable) |
| Theme | Any Moodle theme |
Frequently Asked Questions
The CPU/RAM/Disk shows "Unavailable" — is the plugin broken?
No. Your hosting provider has restricted access to the OS-level files the block reads from. This is common on shared hosting. The block itself is working correctly.
Why does the Hosting Type say "unconfirmed"?
Because it genuinely cannot be confirmed from within PHP alone. The label is a heuristic estimate based on available signals, not a definitive answer. See the Hosting Type Detection section above for full details.
Can I add this block to pages other than the Dashboard?
No — the block is restricted to My Dashboard (applicable_formats) by design. This keeps sensitive server information away from course pages.
Will this slow down my Moodle site?
Extremely unlikely. All data is read from OS memory-mapped files or built-in PHP functions. The total execution time per page load is under a millisecond on any modern server. No database queries are performed.
The Hosting Type score seems wrong for my setup.
This is expected in some cases — see the "Why this can be wrong" section above. The signal reasons shown under the label should help you understand what the block detected.
License
GNU General Public License v3 or later
http://www.gnu.org/copyleft/gpl.html
1.0.2 (2026031601)
1.0.2
Plugin type: Blocks
Frankenstyle component name: block_servermon
Version build number: 2026031601
Version release name: 1.0.2
Maturity: Stable
Supported Moodle versions: 4.4, 4.5, 5.0, 5.1
Repository URL (Git): https://github.com/verzog/block_servermon
Repository branch:
Repository tag:
Issue/bug tracker URL: https://github.com/verzog/block_servermon/issues
Server Monitor Block for Moodle (block_servermon)
A lightweight Moodle block that displays live server health metrics on the admin Dashboard. Designed as a simple open-source alternative to plugins like Edwiser Site Monitor.
Requirements
- Moodle 5.0 or higher
- PHP 8.1 or higher
- Linux-based server recommended (Windows Server is supported but most metrics will show as unavailable)
- Site administrator role to view the block
Installation
- Download
block_servermon.zip - In Moodle, go to Site Administration ' Plugins ' Install plugins
- Upload the zip file and click Install plugin from the ZIP file
- Follow the on-screen confirmation steps
- Go to your Dashboard, turn editing on, click Add a block, and select Server Monitor
Alternatively, unzip the file and copy the servermon folder to /blocks/ on your server, then visit Site Administration ' Notifications to complete the install.
What It Shows
Resource Gauges
Three colour-coded progress bars are shown at the top of the block:
| Metric | Source | Notes |
|---|---|---|
| CPU Load | /proc/cpuinfo, sys_getloadavg() | Shows current load as % of total CPU capacity, plus 1m/5m/15m load averages |
| Memory (RAM) | /proc/meminfo | Shows used/free/total in GB |
| Disk Space | disk_total_space(), disk_free_space() | Shows used/free/total in GB for the root partition |
Status colours
| Colour | Meaning | Threshold |
|---|---|---|
| 🟢 Green | OK | Below 60% |
| 🟡 Amber | Moderate | 60–80% |
| 🔴 Red | High | Above 80% |
Server Info Panel
Collapsed by default. Click Server Info - to expand. Contains:
| Field | Description |
|---|---|
| Server Uptime | How long the server has been running since last reboot, read from /proc/uptime |
| PHP Version | The PHP version Moodle is currently running on |
| Database | Database engine family and version, read from Moodle's $DB object (e.g. PostgreSQL 15.4, MySQL 8.0.32) |
| Hostname | The server's hostname as returned by gethostname() |
| Web Server | The web server software (e.g. Apache, Nginx), read from $_SERVER['SERVER_SOFTWARE'] |
| Hosting Type | A heuristic estimate of the hosting environment (see below) |
| Last Checked | The timestamp when the block last rendered — data is live on each page load |
Hosting Type Detection
The block attempts to classify the server environment using a six-layer detection system. This is a best-effort heuristic only — results should be treated as an informed guess rather than a confirmed fact.
Detection layers (in priority order)
Layer 1 — Control panel / platform fingerprints
| Platform | Files/dirs checked | Label shown |
|---|---|---|
| YunoHost | /etc/yunohost/, /usr/share/yunohost/ | YunoHost / Self-hosted VPS |
| Plesk | /etc/plesk/, /usr/local/psa/version | VPS or Dedicated with Plesk |
| cPanel | /usr/local/cpanel/, /etc/cpanel/cpanel.config | Shared or VPS with cPanel |
| DirectAdmin | /etc/directadmin/directadmin.conf | Shared or VPS with DirectAdmin |
| Webmin/Virtualmin | /etc/webmin/, /usr/share/webmin/version | Self-managed Server with Webmin |
| ISPConfig | /usr/local/ispconfig/ | Shared or VPS with ISPConfig |
| HestiaCP / VestaCP | /usr/local/hestia/, /usr/local/vesta/ | VPS with HestiaCP/VestaCP |
| CentOS Web Panel | /usr/local/cwpsrv/ | VPS with CWP |
| Parallels/Virtuozzo | /opt/psa/ | Shared or VPS with Parallels |
Layer 2 — Cloud provider detection
Reads /sys/class/dmi/id/sys_vendor to identify the cloud host directly.
| Provider detected |
|---|
| AWS, Azure, Google Cloud, DigitalOcean, Hetzner, Contabo, Vultr, Linode/Akamai, OVH |
Layer 3 — Virtualisation type
Reads /sys/class/dmi/id/product_name and /proc/cpuinfo hypervisor flags.
| Detected | Notes |
|---|---|
| KVM | Used by Contabo, DigitalOcean, Vultr, Linode |
| VMware | VMware ESXi environments |
| VirtualBox | Local development machines |
| QEMU/KVM | QEMU-based hypervisors |
| Xen | AWS older instances, some dedicated providers |
| Hyper-V | Microsoft Azure, Windows Server hosts |
| Container (LXC/Docker) | Detected via /proc/1/environ |
Layer 4 — Bare-metal chassis detection
Reads /sys/class/dmi/id/chassis_type. Chassis codes 17 (Rack Mount), 23 (Blade), and 24 (Blade Enclosure) indicate physical dedicated hardware.
Layer 5 — OS fingerprint
Reads /etc/os-release, /etc/debian_version, or /etc/redhat-release for the Linux distribution name and version. Shown as a signal detail only (e.g. Debian GNU/Linux 12 (bookworm)).
Layer 6 — Resource-based scoring (final fallback)
Only used if no label was set by layers 1–4. Scores based on CPU count, RAM, /proc/net/dev readability, and PHP process username.
| Score | Label |
|---|---|
| 3+ | Likely Dedicated Server |
| 1–2 | Likely VPS or Shared Hosting |
| 0 | Likely Shared Hosting |
Limitations
Metrics that cannot be shown
The following are not available via SQL or PHP and therefore cannot be shown by this block:
- Network I/O (bandwidth in/out)
- Per-process CPU breakdown
- GPU usage
- Temperature sensors
Hosting restrictions
Some shared hosting providers restrict access to /proc/meminfo, /proc/cpuinfo, or sys_getloadavg(). If your host blocks these, the affected metrics will display as Unavailable. This is a hosting-level restriction and cannot be worked around from within a Moodle plugin.
Data is not historical
The block reads live values at the moment the Dashboard page loads. It does not store historical data or generate graphs over time. For historical monitoring, consider a dedicated server monitoring tool such as Netdata, Munin, or Glances.
Visibility & Security
- The block content is only rendered for site administrators. Any other user who somehow has the block on their dashboard will see nothing.
- No data is written to the Moodle database by this block.
- No personal data is collected or stored (see Privacy section below).
Privacy
This block stores no personal data of any kind. It reads server-level OS metrics only. The Moodle privacy API null provider is implemented accordingly.
Compatibility
| Component | Requirement |
|---|---|
| Moodle | 5.0+ |
| PHP | 8.1+ |
| Database | MySQL, MariaDB, PostgreSQL (block does not query the DB directly) |
| OS | Linux (full support), Windows Server (partial — gauges unavailable) |
| Theme | Any Moodle theme |
Frequently Asked Questions
The CPU/RAM/Disk shows "Unavailable" — is the plugin broken?
No. Your hosting provider has restricted access to the OS-level files the block reads from. This is common on shared hosting. The block itself is working correctly.
Why does the Hosting Type say "unconfirmed"?
Because it genuinely cannot be confirmed from within PHP alone. The label is a heuristic estimate based on available signals, not a definitive answer. See the Hosting Type Detection section above for full details.
Can I add this block to pages other than the Dashboard?
No — the block is restricted to My Dashboard (applicable_formats) by design. This keeps sensitive server information away from course pages.
Will this slow down my Moodle site?
Extremely unlikely. All data is read from OS memory-mapped files or built-in PHP functions. The total execution time per page load is under a millisecond on any modern server. No database queries are performed.
The Hosting Type score seems wrong for my setup.
This is expected in some cases — see the "Why this can be wrong" section above. The signal reasons shown under the label should help you understand what the block detected.
License
GNU General Public License v3 or later
http://www.gnu.org/copyleft/gpl.html
1.0.0 (2026031200)
1.0.0
Plugin type: Blocks
Frankenstyle component name: block_servermon
Version build number: 2026031200
Version release name: 1.0.0
Maturity: Stable
Supported Moodle versions: 5.1
Repository URL (Git):
Repository branch:
Repository tag:
Issue/bug tracker URL: https://github.com/verzog/block_servermon/issues
Server Monitor Block for Moodle (block_servermon)
A lightweight Moodle block that displays live server health metrics on the admin Dashboard. Designed as a simple open-source alternative to plugins like Edwiser Site Monitor.
Requirements
- Moodle 5.1 or higher
- PHP 8.1 or higher
- Linux-based server recommended (Windows Server is supported but most metrics will show as unavailable)
- Site administrator role to view the block
Installation
- Download
block_servermon.zip - In Moodle, go to Site Administration ' Plugins ' Install plugins
- Upload the zip file and click Install plugin from the ZIP file
- Follow the on-screen confirmation steps
- Go to your Dashboard, turn editing on, click Add a block, and select Server Monitor
Alternatively, unzip the file and copy the servermon folder to /blocks/ on your server, then visit Site Administration ' Notifications to complete the install.
What It Shows
Resource Gauges
Three colour-coded progress bars are shown at the top of the block:
| Metric | Source | Notes |
|---|---|---|
| CPU Load | /proc/cpuinfo, sys_getloadavg() | Shows current load as % of total CPU capacity, plus 1m/5m/15m load averages |
| Memory (RAM) | /proc/meminfo | Shows used/free/total in GB |
| Disk Space | disk_total_space(), disk_free_space() | Shows used/free/total in GB for the root partition |
Status colours
| Colour | Meaning | Threshold |
|---|---|---|
| 🟢 Green | OK | Below 60% |
| 🟡 Amber | Moderate | 60–80% |
| 🔴 Red | High | Above 80% |
Server Info Panel
Collapsed by default. Click Server Info - to expand. Contains:
| Field | Description |
|---|---|
| Server Uptime | How long the server has been running since last reboot, read from /proc/uptime |
| PHP Version | The PHP version Moodle is currently running on |
| Database | Database engine family and version, read from Moodle's $DB object (e.g. PostgreSQL 15.4, MySQL 8.0.32) |
| Hostname | The server's hostname as returned by gethostname() |
| Web Server | The web server software (e.g. Apache, Nginx), read from $_SERVER['SERVER_SOFTWARE'] |
| Hosting Type | A heuristic estimate of the hosting environment (see below) |
| Last Checked | The timestamp when the block last rendered — data is live on each page load |
Hosting Type Detection
The block attempts to classify the server environment using a six-layer detection system. This is a best-effort heuristic only — results should be treated as an informed guess rather than a confirmed fact.
Detection layers (in priority order)
Layer 1 — Control panel / platform fingerprints
| Platform | Files/dirs checked | Label shown |
|---|---|---|
| YunoHost | /etc/yunohost/, /usr/share/yunohost/ | YunoHost / Self-hosted VPS |
| Plesk | /etc/plesk/, /usr/local/psa/version | VPS or Dedicated with Plesk |
| cPanel | /usr/local/cpanel/, /etc/cpanel/cpanel.config | Shared or VPS with cPanel |
| DirectAdmin | /etc/directadmin/directadmin.conf | Shared or VPS with DirectAdmin |
| Webmin/Virtualmin | /etc/webmin/, /usr/share/webmin/version | Self-managed Server with Webmin |
| ISPConfig | /usr/local/ispconfig/ | Shared or VPS with ISPConfig |
| HestiaCP / VestaCP | /usr/local/hestia/, /usr/local/vesta/ | VPS with HestiaCP/VestaCP |
| CentOS Web Panel | /usr/local/cwpsrv/ | VPS with CWP |
| Parallels/Virtuozzo | /opt/psa/ | Shared or VPS with Parallels |
Layer 2 — Cloud provider detection
Reads /sys/class/dmi/id/sys_vendor to identify the cloud host directly.
| Provider detected |
|---|
| AWS, Azure, Google Cloud, DigitalOcean, Hetzner, Contabo, Vultr, Linode/Akamai, OVH |
Layer 3 — Virtualisation type
Reads /sys/class/dmi/id/product_name and /proc/cpuinfo hypervisor flags.
| Detected | Notes |
|---|---|
| KVM | Used by Contabo, DigitalOcean, Vultr, Linode |
| VMware | VMware ESXi environments |
| VirtualBox | Local development machines |
| QEMU/KVM | QEMU-based hypervisors |
| Xen | AWS older instances, some dedicated providers |
| Hyper-V | Microsoft Azure, Windows Server hosts |
| Container (LXC/Docker) | Detected via /proc/1/environ |
Layer 4 — Bare-metal chassis detection
Reads /sys/class/dmi/id/chassis_type. Chassis codes 17 (Rack Mount), 23 (Blade), and 24 (Blade Enclosure) indicate physical dedicated hardware.
Layer 5 — OS fingerprint
Reads /etc/os-release, /etc/debian_version, or /etc/redhat-release for the Linux distribution name and version. Shown as a signal detail only (e.g. Debian GNU/Linux 12 (bookworm)).
Layer 6 — Resource-based scoring (final fallback)
Only used if no label was set by layers 1–4. Scores based on CPU count, RAM, /proc/net/dev readability, and PHP process username.
| Score | Label |
|---|---|
| 3+ | Likely Dedicated Server |
| 1–2 | Likely VPS or Shared Hosting |
| 0 | Likely Shared Hosting |
Limitations
Metrics that cannot be shown
The following are not available via SQL or PHP and therefore cannot be shown by this block:
- Network I/O (bandwidth in/out)
- Per-process CPU breakdown
- GPU usage
- Temperature sensors
Hosting restrictions
Some shared hosting providers restrict access to /proc/meminfo, /proc/cpuinfo, or sys_getloadavg(). If your host blocks these, the affected metrics will display as Unavailable. This is a hosting-level restriction and cannot be worked around from within a Moodle plugin.
Data is not historical
The block reads live values at the moment the Dashboard page loads. It does not store historical data or generate graphs over time. For historical monitoring, consider a dedicated server monitoring tool such as Netdata, Munin, or Glances.
Visibility & Security
- The block content is only rendered for site administrators. Any other user who somehow has the block on their dashboard will see nothing.
- No data is written to the Moodle database by this block.
- No personal data is collected or stored (see Privacy section below).
Privacy
This block stores no personal data of any kind. It reads server-level OS metrics only. The Moodle privacy API null provider is implemented accordingly.
Compatibility
| Component | Requirement |
|---|---|
| Moodle | 5.0+ |
| PHP | 8.1+ |
| Database | MySQL, MariaDB, PostgreSQL (block does not query the DB directly) |
| OS | Linux (full support), Windows Server (partial — gauges unavailable) |
| Theme | Any Moodle theme |
Frequently Asked Questions
The CPU/RAM/Disk shows "Unavailable" — is the plugin broken?
No. Your hosting provider has restricted access to the OS-level files the block reads from. This is common on shared hosting. The block itself is working correctly.
Why does the Hosting Type say "unconfirmed"?
Because it genuinely cannot be confirmed from within PHP alone. The label is a heuristic estimate based on available signals, not a definitive answer. See the Hosting Type Detection section above for full details.
Can I add this block to pages other than the Dashboard?
No — the block is restricted to My Dashboard (applicable_formats) by design. This keeps sensitive server information away from course pages.
Will this slow down my Moodle site?
Extremely unlikely. All data is read from OS memory-mapped files or built-in PHP functions. The total execution time per page load is under a millisecond on any modern server. No database queries are performed.
The Hosting Type score seems wrong for my setup.
This is expected in some cases — see the "Why this can be wrong" section above. The signal reasons shown under the label should help you understand what the block detected.
License
GNU General Public License v3 or later
http://www.gnu.org/copyleft/gpl.html