Monitoring
Versions
Current version
1.0.0 (2026062300)
1.0.0
Plugin type: Administration tools
Frankenstyle component name: tool_monitoring
Version build number: 2026062300
Version release name: 1.0.0
Maturity: Stable
Supported Moodle versions: 5.0, 5.1, 5.2
Repository URL (Git): https://github.com/daniil-berg/moodle-tool_monitoring
Repository branch: main
Repository tag: v1.0.0
Issue/bug tracker URL: https://github.com/daniil-berg/moodle-tool_monitoring/issues
Monitoring Moodle - tool_monitoring
The tool_monitoring Plugin makes it easy to integrate standard monitoring setups (such as Prometheus & Grafana) with any running Moodle instance.
Development started at the 2025 Moodle Moot DACH DevCamp, where the project won 1st prize, showing strong community demand for a standardized monitoring solution for Moodle.
Table of Contents (Click to expand/collapse)
- Features
- Installation
- Usage
- Admin Settings
- Grouping metrics with tags (optional)
- Prometheus configuration
- Setting up a Grafana dashboard
- Adding a custom metric
- Making a metric configurable (advanced)
- Writing a custom exporter sub-plugin (advanced)
- Terminology
- Architecture
- Base
metricclass - Hook
metric_collection - DB table and
registered_metricinterface - Central
metrics_manager - Configurable metrics (advanced)
- Exporter sub-plugins
- Base
- Copyright
Features
- 🍱 Just works: Ready-made with sensible Moodle metrics and a Prometheus endpoint out of the box.
- -️ Extensible: To define your own metric, simply extend the
metricclass and register it for collection. - -️ Generic: Agnostic towards the monitoring software used; supports custom exporters.
- '' Admin-friendly: Convenient admin dashboard to view and configure individual metrics and exporters.
- 🔧 Customizable: For advanced use, metrics can be configured and even tagged via the Moodle Tag API.
Installation
The minimum supported Moodle version is 5.0 (build 2025041400).
You install tool_monitoring just like any other Moodle plugin.
Starting with Moodle 5.1, it belongs in the public/admin/tool/monitoring directory.
(For Moodle 5.0 it goes into admin/tool/monitoring.)
For example, using git from the root directory of your Moodle 5.1+ installation:
$ git clone \

      https://github.com/daniil-berg/moodle-tool_monitoring.git \

      public/admin/tool/monitoring
For other options and general plugin installation instructions, see the official Moodle documentation.
Usage
Admin Settings
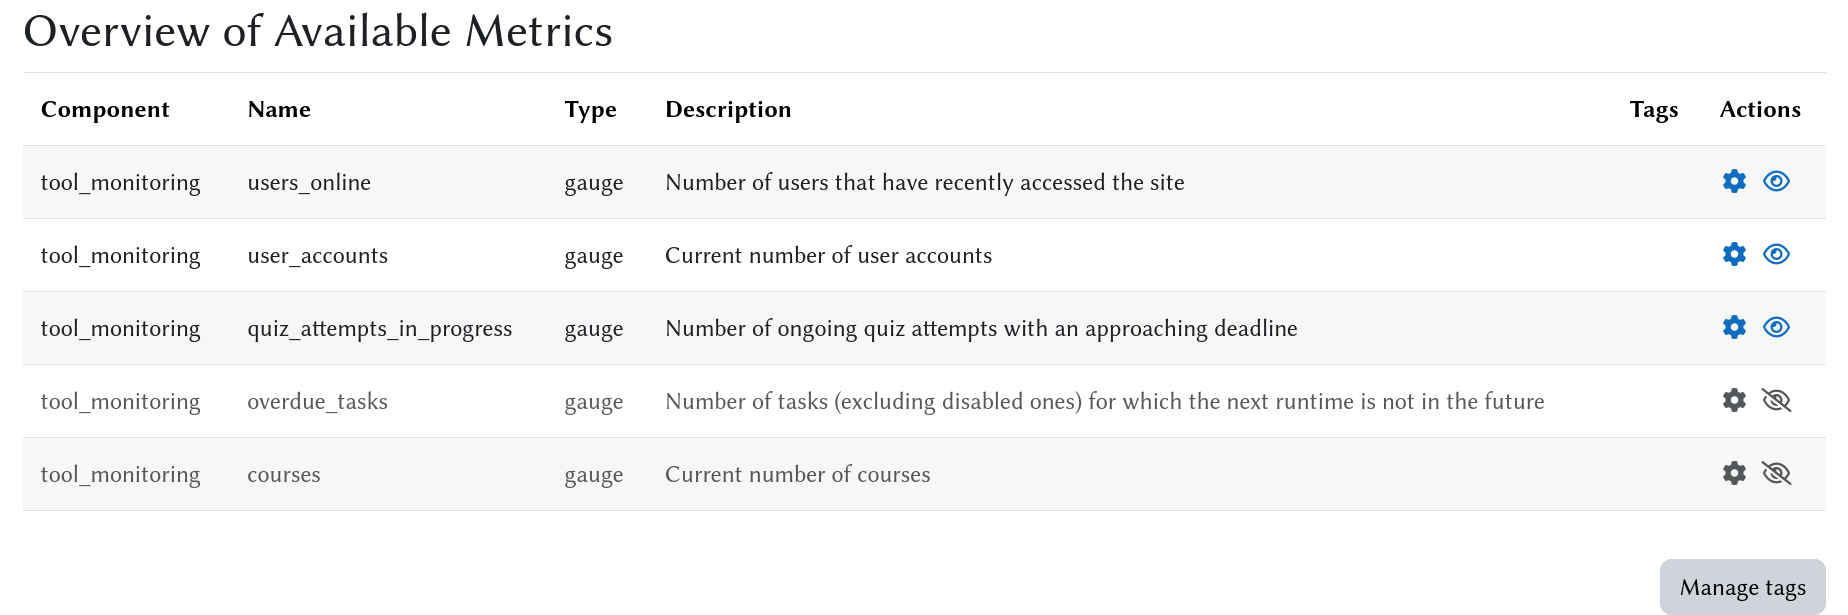
Dashboard
The admin dashboard can be found at /admin/tool/monitoring or by navigating to Site administration > Plugins > Admin tools > Monitoring > Overview.
There you can view all registered metrics, enable/disable them, add/remove metric tags, and configure some metrics individually.
Pre-installed metrics
Out of the box, tool_monitoring comes with the following metrics:
| Name | Description | Partitioned by | Configurable? |
|:---------------------------:|--------------------------------------------------------------|--------------------------------------------------------------------------------------|:-----------------------------:|
| courses | Current number of courses. | visible (true/false) | no |
| overdue_tasks | Number of tasks that should have run already but have not | type (adhoc/scheduled) | no |
| quiz_attempts_in_progress | Number of ongoing quiz attempts with an approaching deadline | - | yes |
| user_accounts | Current number of user accounts | auth (available methods), suspended (true/false), deleted (true/false) | no |
| users_online | Number of users that have recently accessed the site | time_window (last user access time to count, multiple configurable) | yes |
[!NOTE]
Any Moodle component can add its own custom metrics.
(See the section "Adding a custom metric" for details.)
Once a metric is registered, it will be listed in the dashboard as well.
Metric configuration
Some metrics have their own specific configuration options.
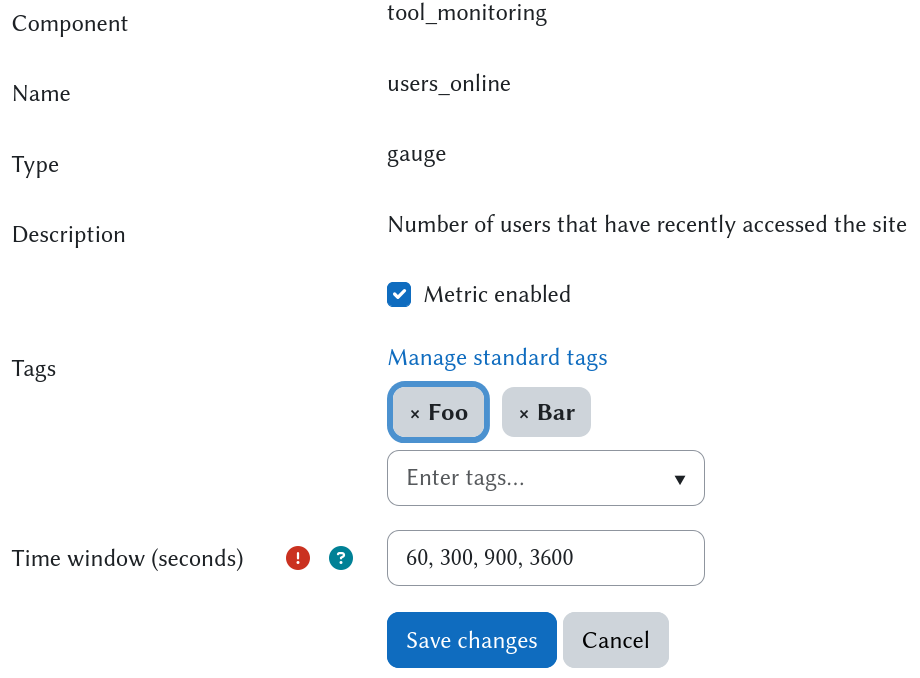
As an example, the pre-installed users_online metric has configurable time windows for counting users' most recent access.
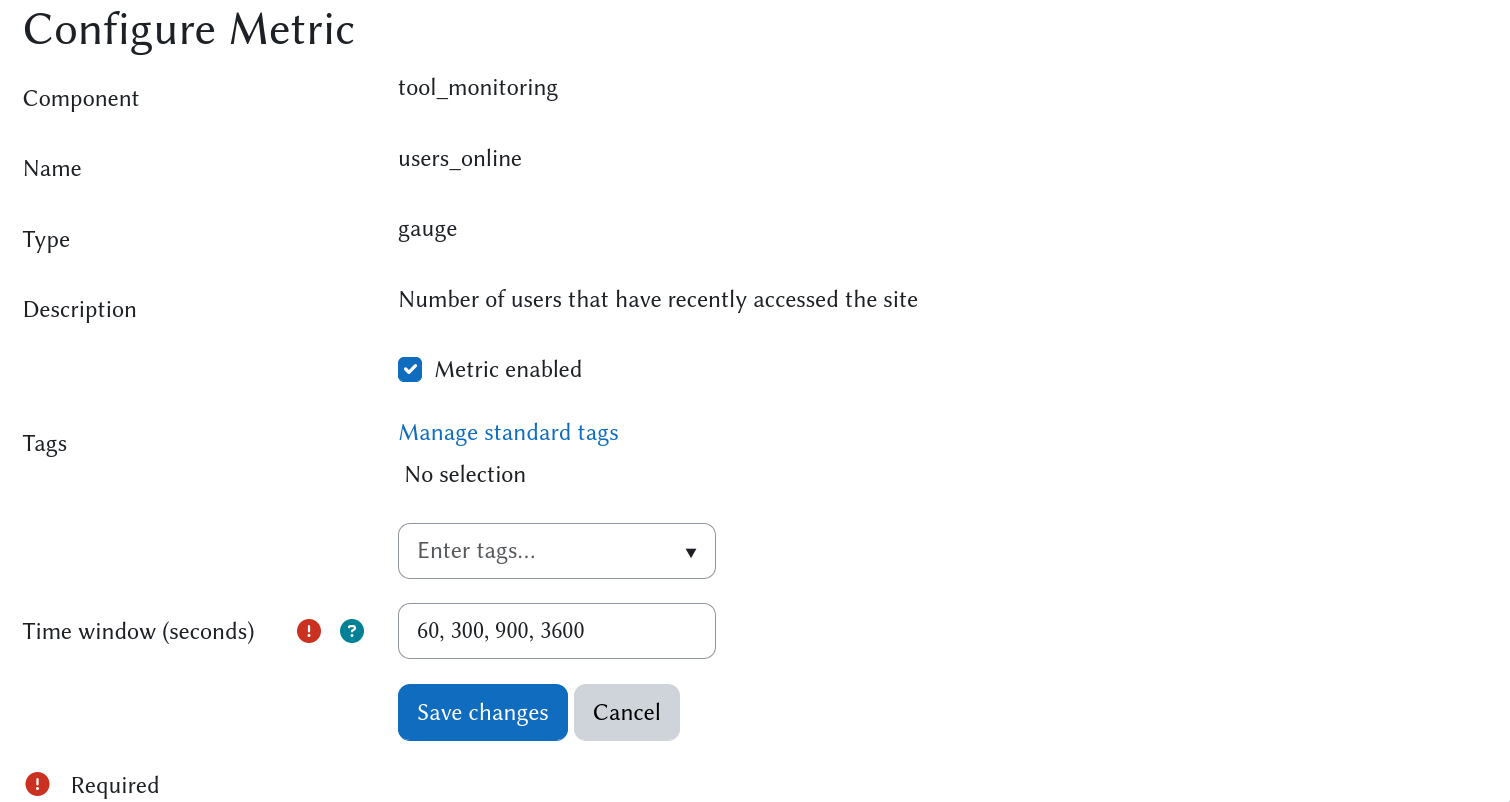
To configure it, click on the gear icon next to it on the dashboard.
A config page for that metric will open that looks like this:
All metrics share basic settings, namely the enabled/disabled state and associated tags.
But for configurable metrics there can be arbitrary additional form fields.
In this example, the users_online metric has an input field for the time windows in seconds.
The form validates the input to be a comma-separated list of positive integers.
During export a separate labeled metric value will be produced for every specified time window.
After modifying the form data, clicking the "Save changes" button redirects you back to the dashboard.
Exporters
The pre-installed Prometheus exporter has its own settings under Site administration > Plugins > Admin tools > Monitoring > Available Exporters > Prometheus Exporter.
The actual Prometheus endpoint is immediately accessible and can be reached at the route /monitoringexporter_prometheus/metrics.
So if your Moodle web root is https://example.com, the full URL will look like this:
https://example.com/monitoringexporter_prometheus/metrics
[!IMPORTANT]
This relies on the router and your webserver being properly configured.
If not, the endpoint is reached at/r.php/monitoringexporter_prometheus/metrics.
See the relevant Moodle documentation for details.
That endpoint can be secured by specifying an access token (shared secret) in the monitoringexporter_prometheus | prometheus_token setting.
[!WARNING]
The endpoint is unauthenticated by default.
Until aprometheus_tokenis set, anyone who can reach the URL can see all enabled metrics with no credentials.
Even though by default all new metrics are disabled, a token should be set before exposing the endpoint to any untrusted network.
When a token is set, the route handler expects it in the Authorization header in the conventional Authorization: Bearer <token> format.
If no matching header line is found, it falls back to the token query parameter.
[!CAUTION]
Secrets passed via query parameter can leak into server logs.
We strongly advise passing the access token via theAuthorizationheader.
See the Prometheus configuration section for an example.
Grouping metrics with tags (optional)
Sometimes it is useful to not export all available metrics at the same time.
Perhaps some of your metrics are cheap and quick to calculate, allowing tight scrape intervals, while others would impact performance too much if the exporter were called too often.
Or maybe you have different export destinations for some metrics.
Whatever the use case, tool_monitoring allows you to easily group metrics by leveraging Moodle's Tag API.
You can assign arbitrary tags (scoped to their own distinct "metrics" tag area) to any metric.
Exporters can then provide a parameter to filter the produced metrics by the tags they carry.
For example, the included Prometheus exporter accepts a tag query parameter in the URL.
Passing a single tag name will filter out all metrics that do not carry that tag.
Passing a comma-separated list of tags will ensure only metrics that carry all of those tags will be exported.
(Note the AND-condition being applied here.)
For implementation details, take a look at the Prometheus exporter class.
To assign tags to a metric, go to its configuration page.
Then simply enter the tag names in the "Tags" field.
You can add multiple tags at once by putting a comma after each one.
Clicking the "Save changes" button redirects you back to the dashboard.
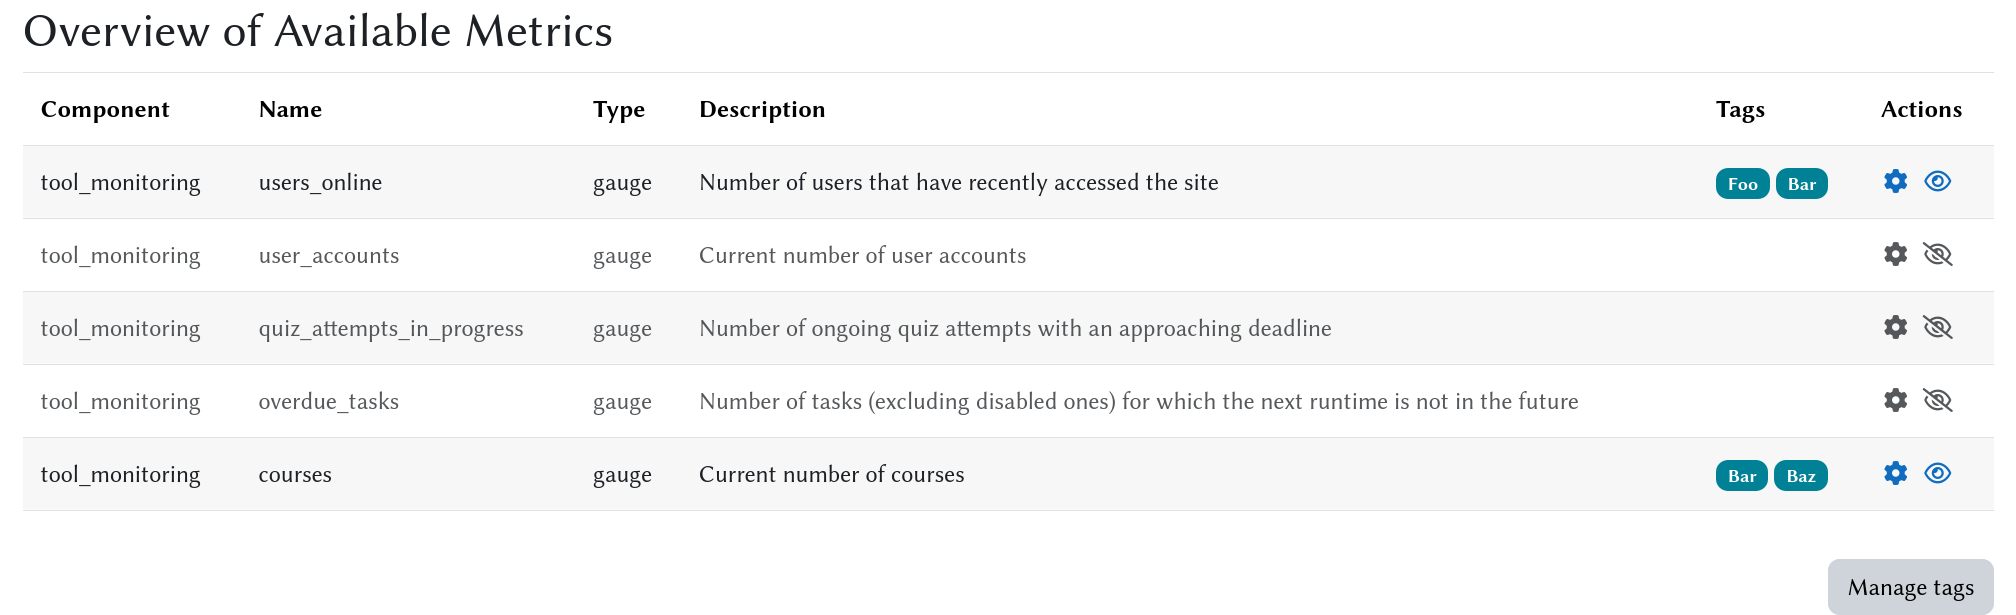
You'll notice the tags you just added show up in the list there.
Clicking on one of them will filter the list of metrics accordingly.
The "Manage tags" button will bring you Moodle's usual tag overview/management page for the monitoring tag collection.
Prometheus configuration
This assumes you have a Prometheus server already up and running.
All you need to do is to add a job to the scrape_configs section in your prometheus.yml like this:
scrape_configs:

  # Choose whatever unique job name you like.

  - job_name: moodle

    # The default scheme is HTTP.

    scheme: https

    # If you have set an access token, provide it here.

    authorization:

      credentials: 'super-secure-secret'

    # Specify the full endpoint path. The default is just '/metrics'.

    # If Moodle routing is not fully configured, you have to prepend '/r.php' to the path.

    metrics_path: /monitoringexporter_prometheus/metrics

    # Specify the target host.

    static_configs:

      - targets: ['example.com']
If you are making use of tags to group specific metrics, you can filter for them by also specifying the tag query parameter.
Multiple tags can be specified by separating them with a comma.
For example, to only scrape metrics that have both the hello and the world tag, you would add a params section like this:
scrape_configs:

  - job_name: moodle-hello-world

    params:

      - tag: ['hello,world']

    # Same config as above...
For exhaustive details about the various config options, see the official Prometheus documentation.
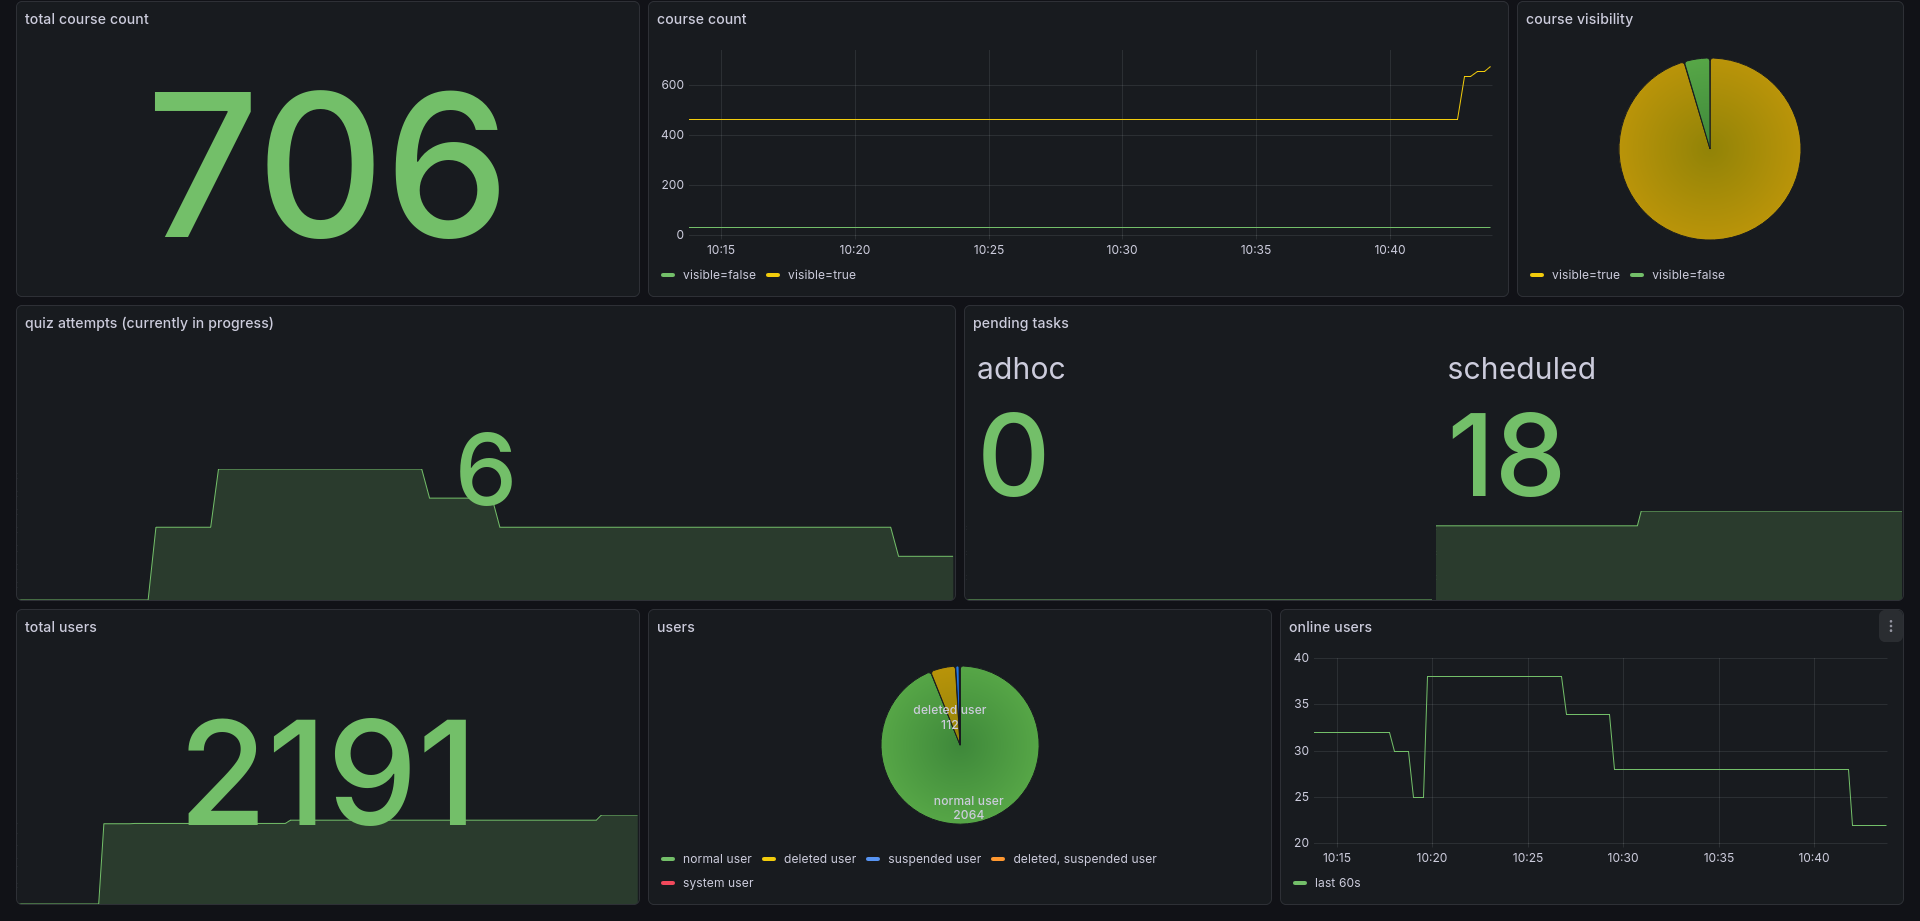
Setting up a Grafana dashboard
This assumes you have configured Prometheus as described above.
You can import the example Grafana dashboard from docs/examples/grafana_dashboard.json into grafana:
Go to "Dashboards" > "New" and select "import" and select the json-file or paste its content there.
Select the Prometheus data source and click "import".
Adding a custom metric
In its most basic form, adding a custom metric consists of just four steps:
- Define the metric class.
- Add a localized metric description.
- Register the metric.
- Enable the metric.
The following is an example of a metric that shows the current number of blocks in use on the site.
For simplicity, we are only interested in the Courses and Course/site summary blocks.
Defining the metric class
Let's say we have our own local_example plugin and the metric class is supposed to live in its classes/metrics directory.
classes/metrics/blocks_used.php (Click to expand/collapse)
namespace local_example\metrics;


use tool_monitoring\metric;

use tool_monitoring\metric_config;

use tool_monitoring\metric_type;

use tool_monitoring\metric_value;


/**

 * Measures the current number of blocks used on the site.

 */

class blocks_used extends metric {

    public function get_type(): metric_type {

        return metric_type::GAUGE;

    }


    public function calculate(metric_config|null $config = null): array {

        global $DB;

        [$insql, $params] = $DB->get_in_or_equal(['course_list', 'course_summary']);

        $sql = "SELECT b.name,

                       COUNT(DISTINCT binst.id) AS count

                  FROM {block} AS b

             LEFT JOIN {block_instances} AS binst ON binst.blockname = b.name

                 WHERE b.name $insql

              GROUP BY b.name";

        $records = $DB->get_records_sql($sql, $params);

        return [

            new metric_value($records['course_list']->count, ['name' => 'course_list']),

            new metric_value($records['course_summary']->count, ['name' => 'course_summary']),

        ];

    }

}
Since blocks can be added as well as removed at any point in time, this is a gauge type metric.
We want to partition the metric by the block name and therefore return an array of two labeled metric_value objects.
Adding a localized metric description
The description is what is shown in the admin dashboard.
It is also what the monitoringexporter_prometheus exporter uses to generate its metric HELP string.
By default, a metric is expected to come with a localized string with the ID "metric:{$name}_desc" where {$name} is the name of the metric.
In our example above, there needs to be a string with the ID metric:blocks_used_desc.
So we need to actually add the text to be displayed to the plugin's language file.
lang/en/local_example.php (Click to expand/collapse)
defined('MOODLE_INTERNAL') || die();

// ...

$string['metric:blocks_used_desc'] = 'Current number of blocks used on the site.';
[!TIP]
You can specify a different string by overriding theget_descriptionmethod in your metric class.
Registering the metric
The new metric class needs to be picked up by the metric_collection hook.
For this, we can use the metric::collect method as a hook callback function.
All we need to do is register that callback.
db/hooks.php (Click to expand/collapse)
use local_example\metrics\blocks_used;

use tool_monitoring\hook\metric_collection;


defined('MOODLE_INTERNAL') || die();


$callbacks = [

    ['hook' => metric_collection::class, 'callback' => [blocks_used::class, 'collect']],

];
Enabling the metric
That is all there is to it.
By default, when a new metric is registered, it will be disabled, which means it is not meant to be exported.
To enable it, first navigate to the admin dashboard.
You should now see a new greyed-out entry in the overview table for the blocks_used metric.
All you need to do is click on the eye icon to enable the metric.
The table row should no longer be greyed out and the metric should now be exported.
Making a metric configurable (advanced)
If a fixed way of calculating a metric is not enough, and you want to allow privileged users to configure it, tool_monitoring provides a convenient way to do so.
This expands the required number of steps we laid out above just a bit:
- Define a custom config class that implements the
metric_configinterface. - Define the metric class.
- Same as above, except instead of extending
metric, inherit from its descendantmetric_with_config. - Implement the regular
metricmethods as well as theget_default_configmethod by returning an instance of
- Same as above, except instead of extending