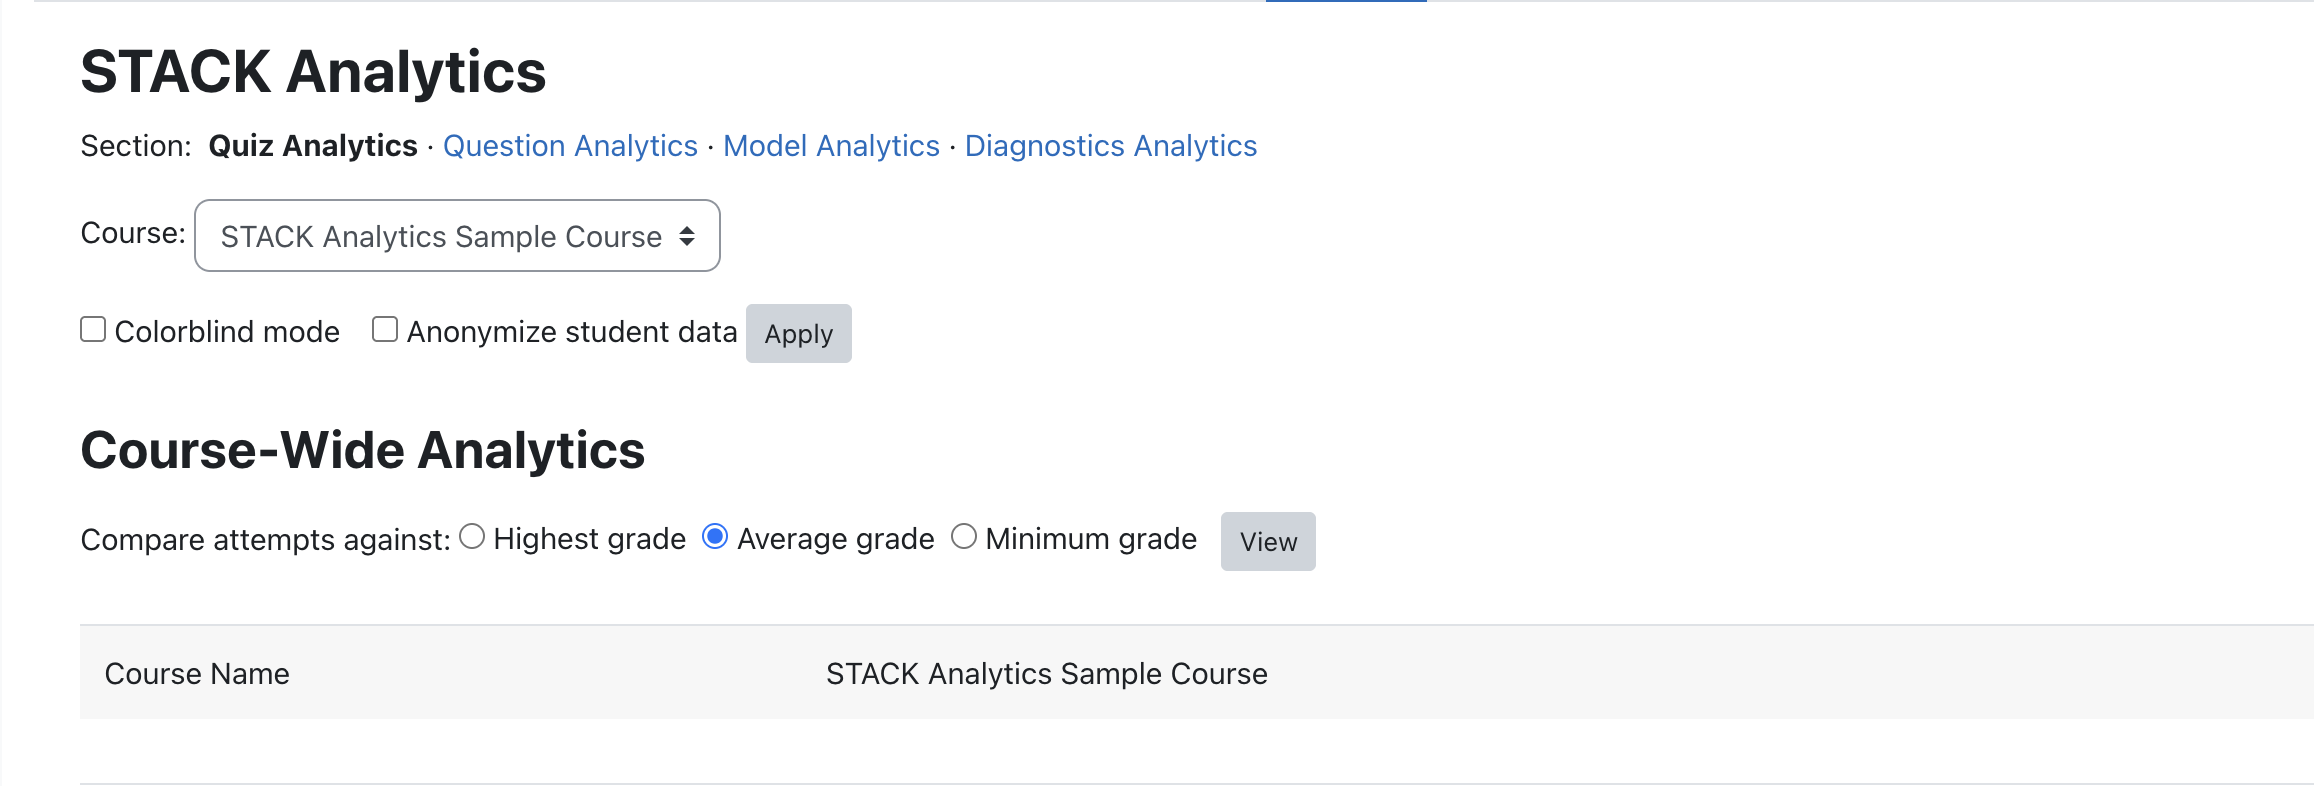
STACK Quiz & Model Analytics brings four sections of insight to STACK (Maxima CAS) quizzes under one installable plugin, without any CSV export/upload step or separate server to configure. Everything reads straight out of Moodle's own database. The four sections include:
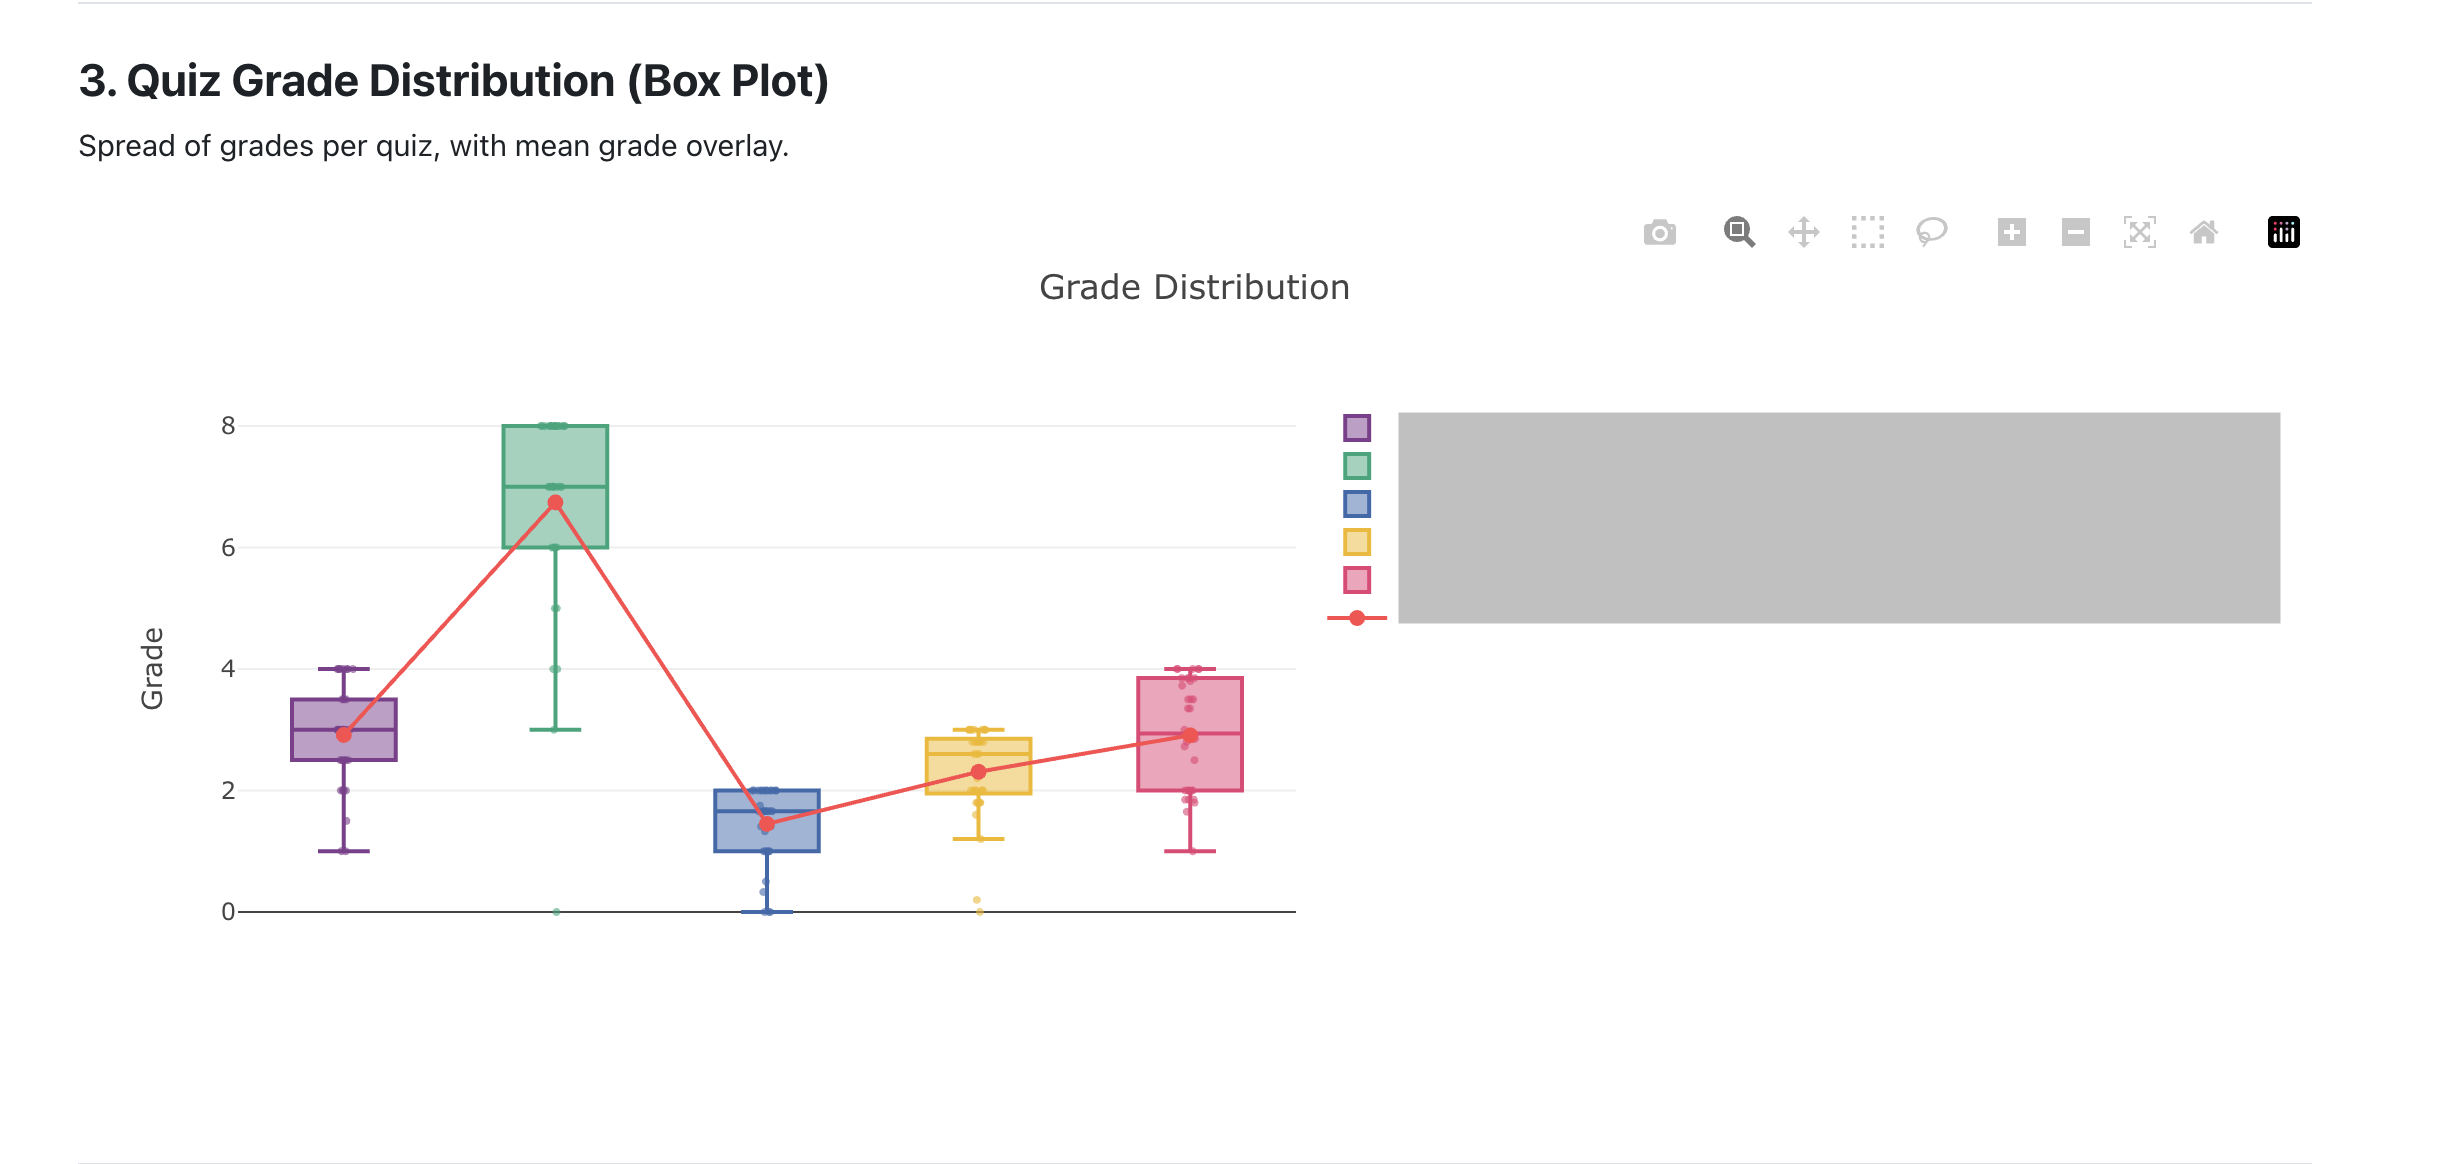
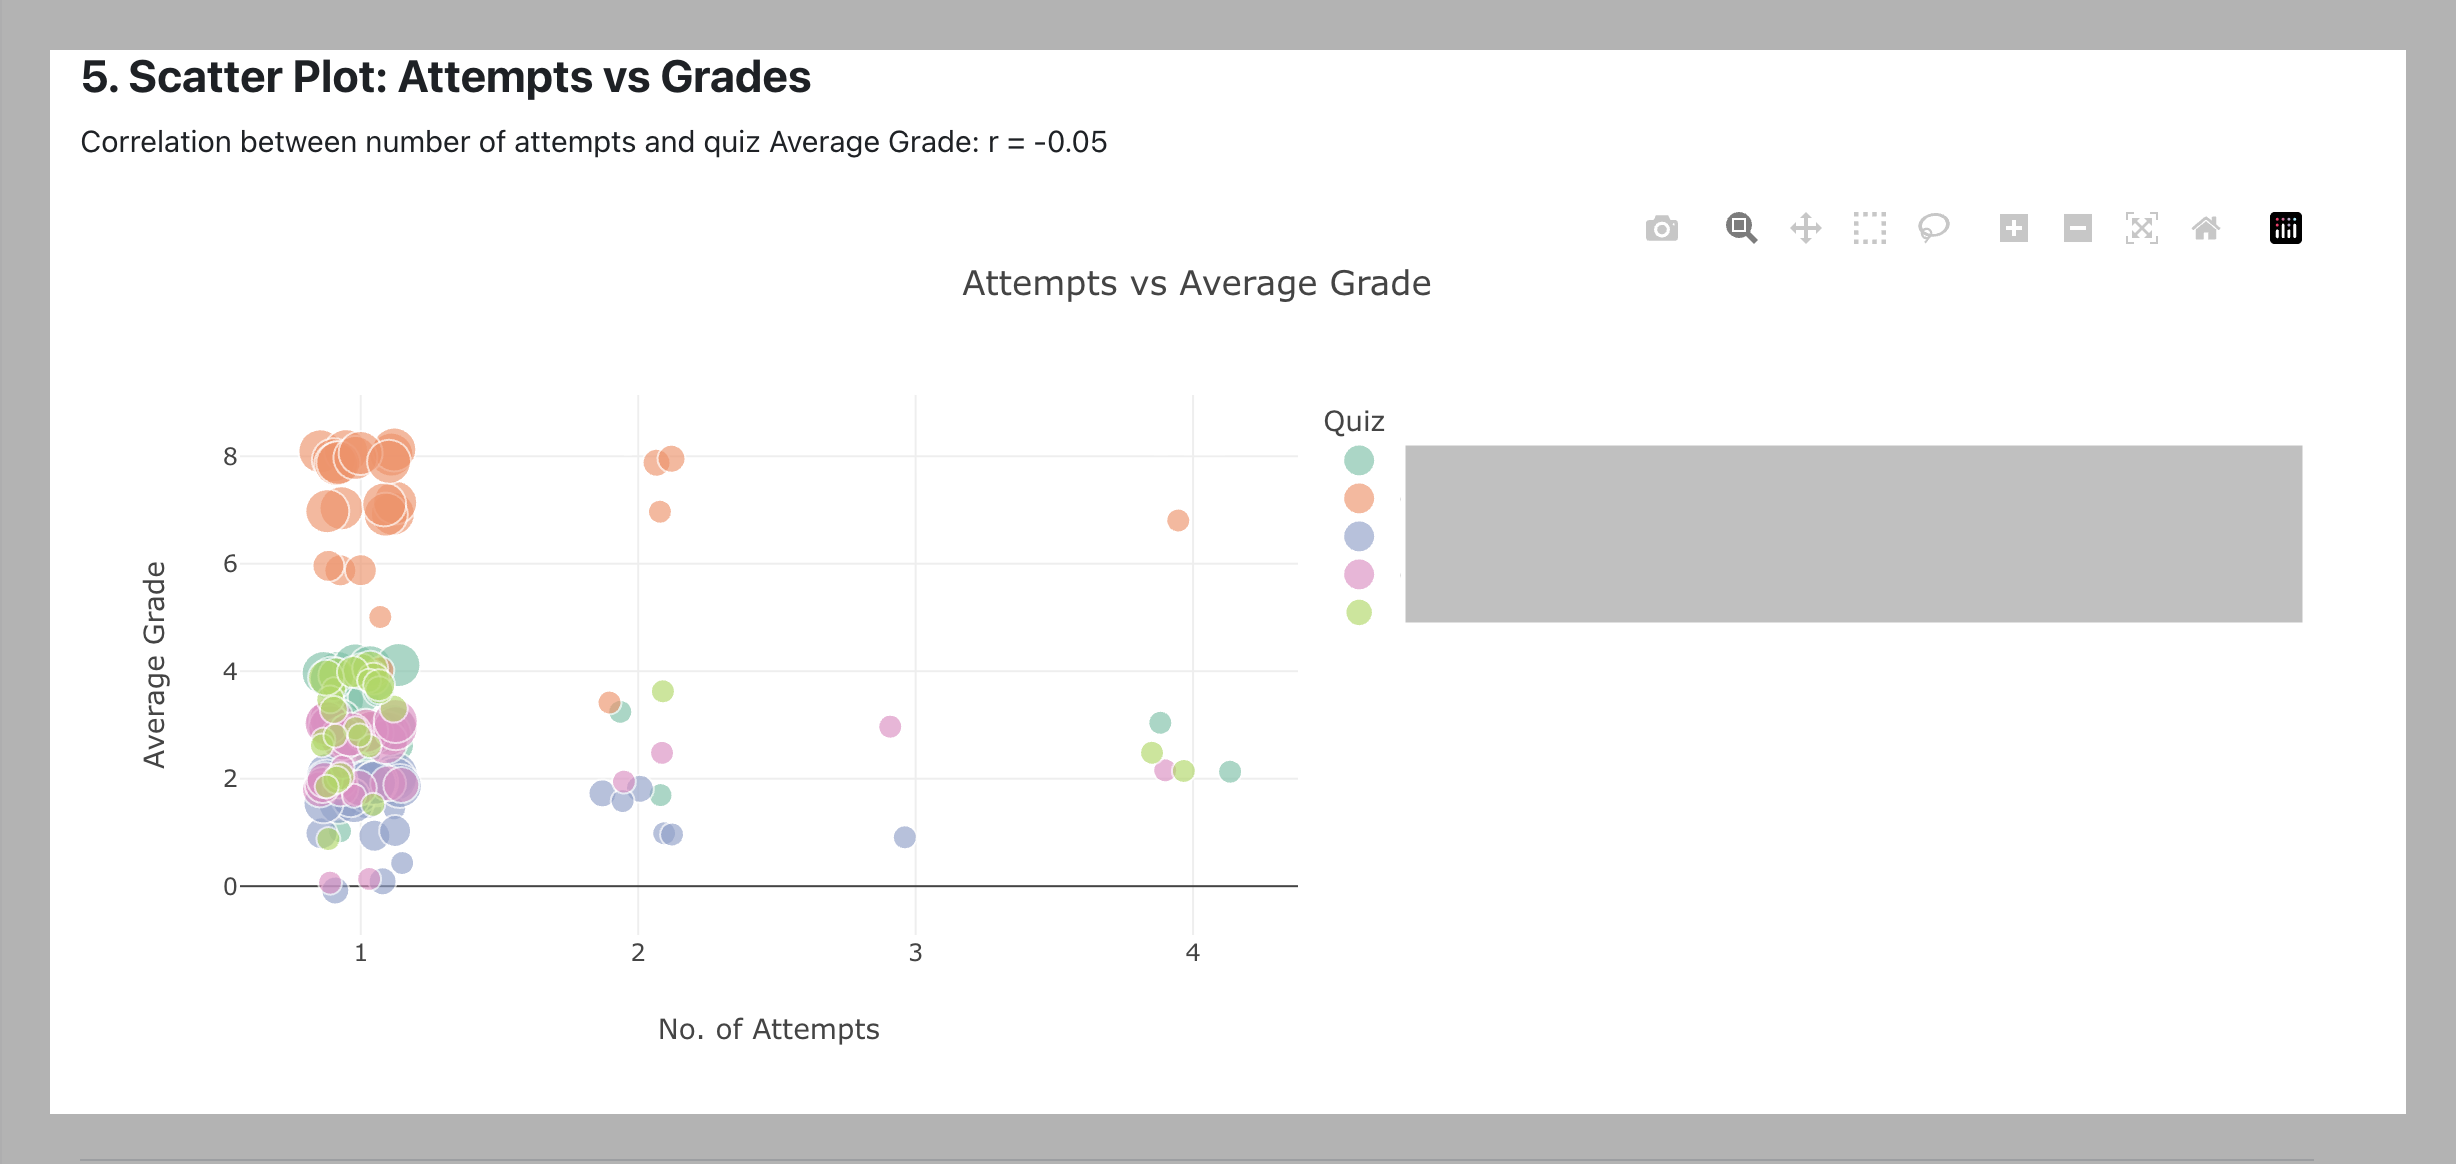
- Quiz Analytics — course-wide view: compare every STACK quiz in a course side by side (grade distributions, engagement over time, an attempts-vs-grade scatter plot, trend lines).
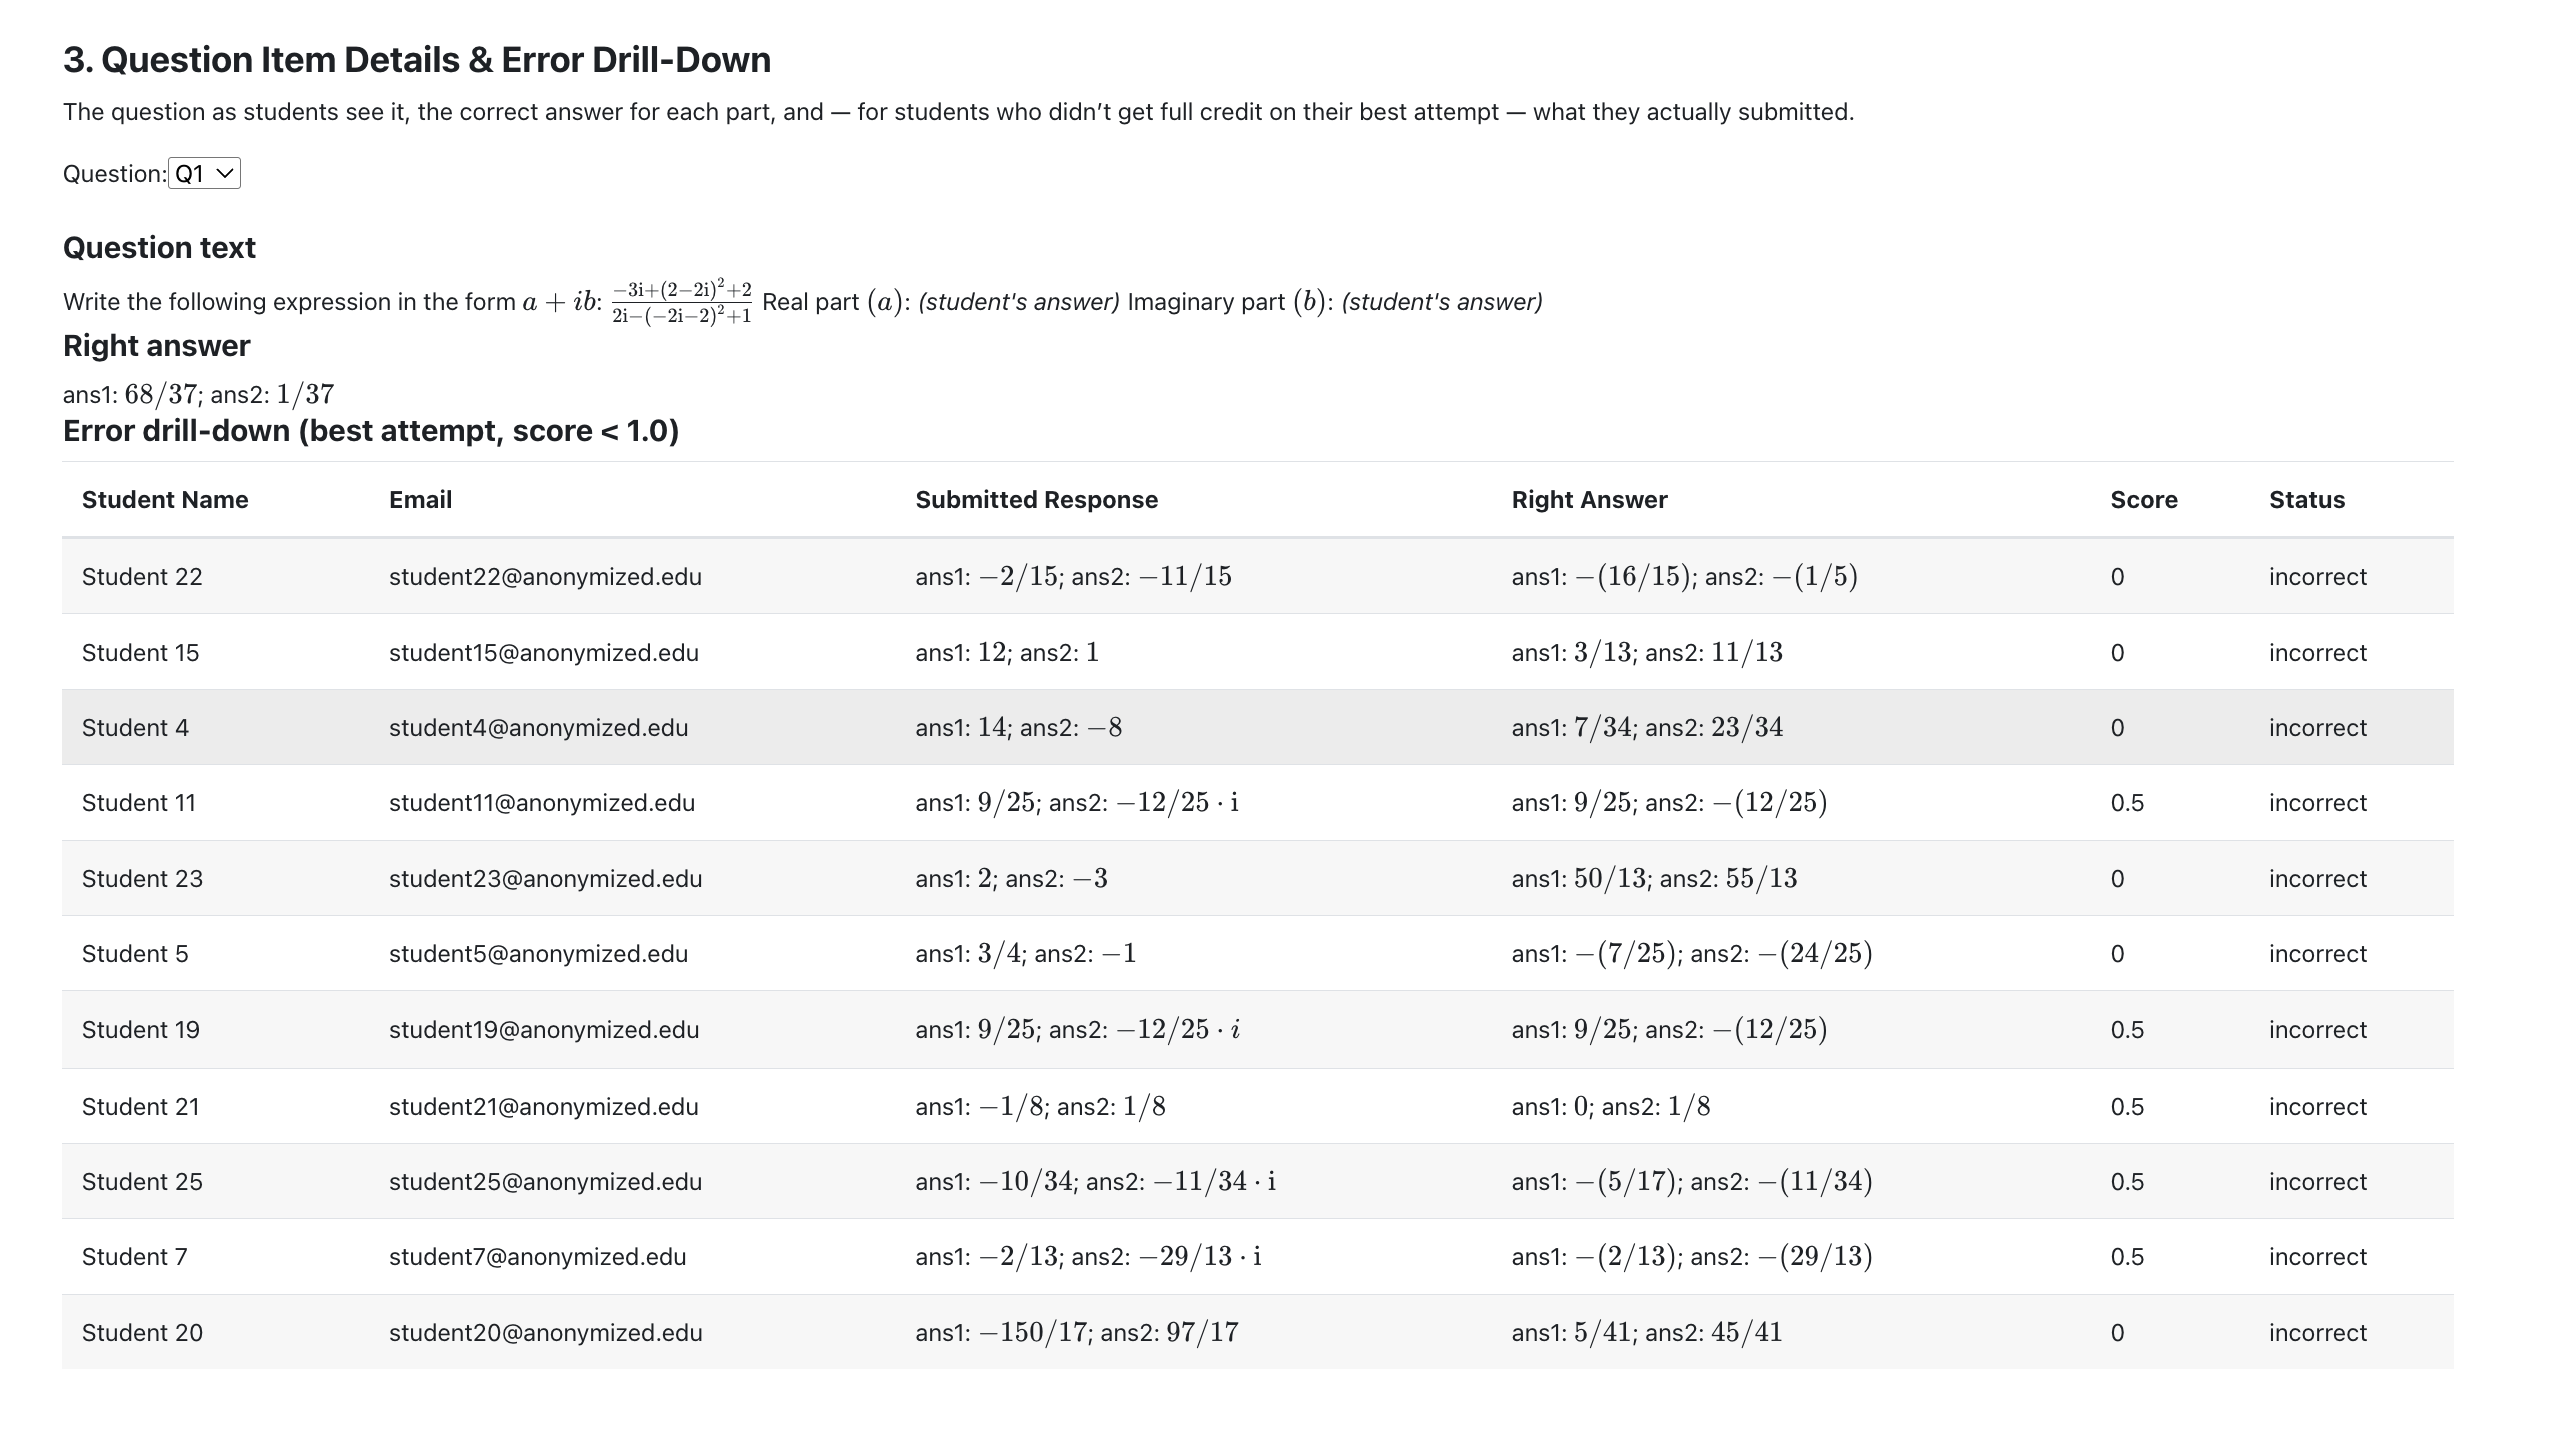
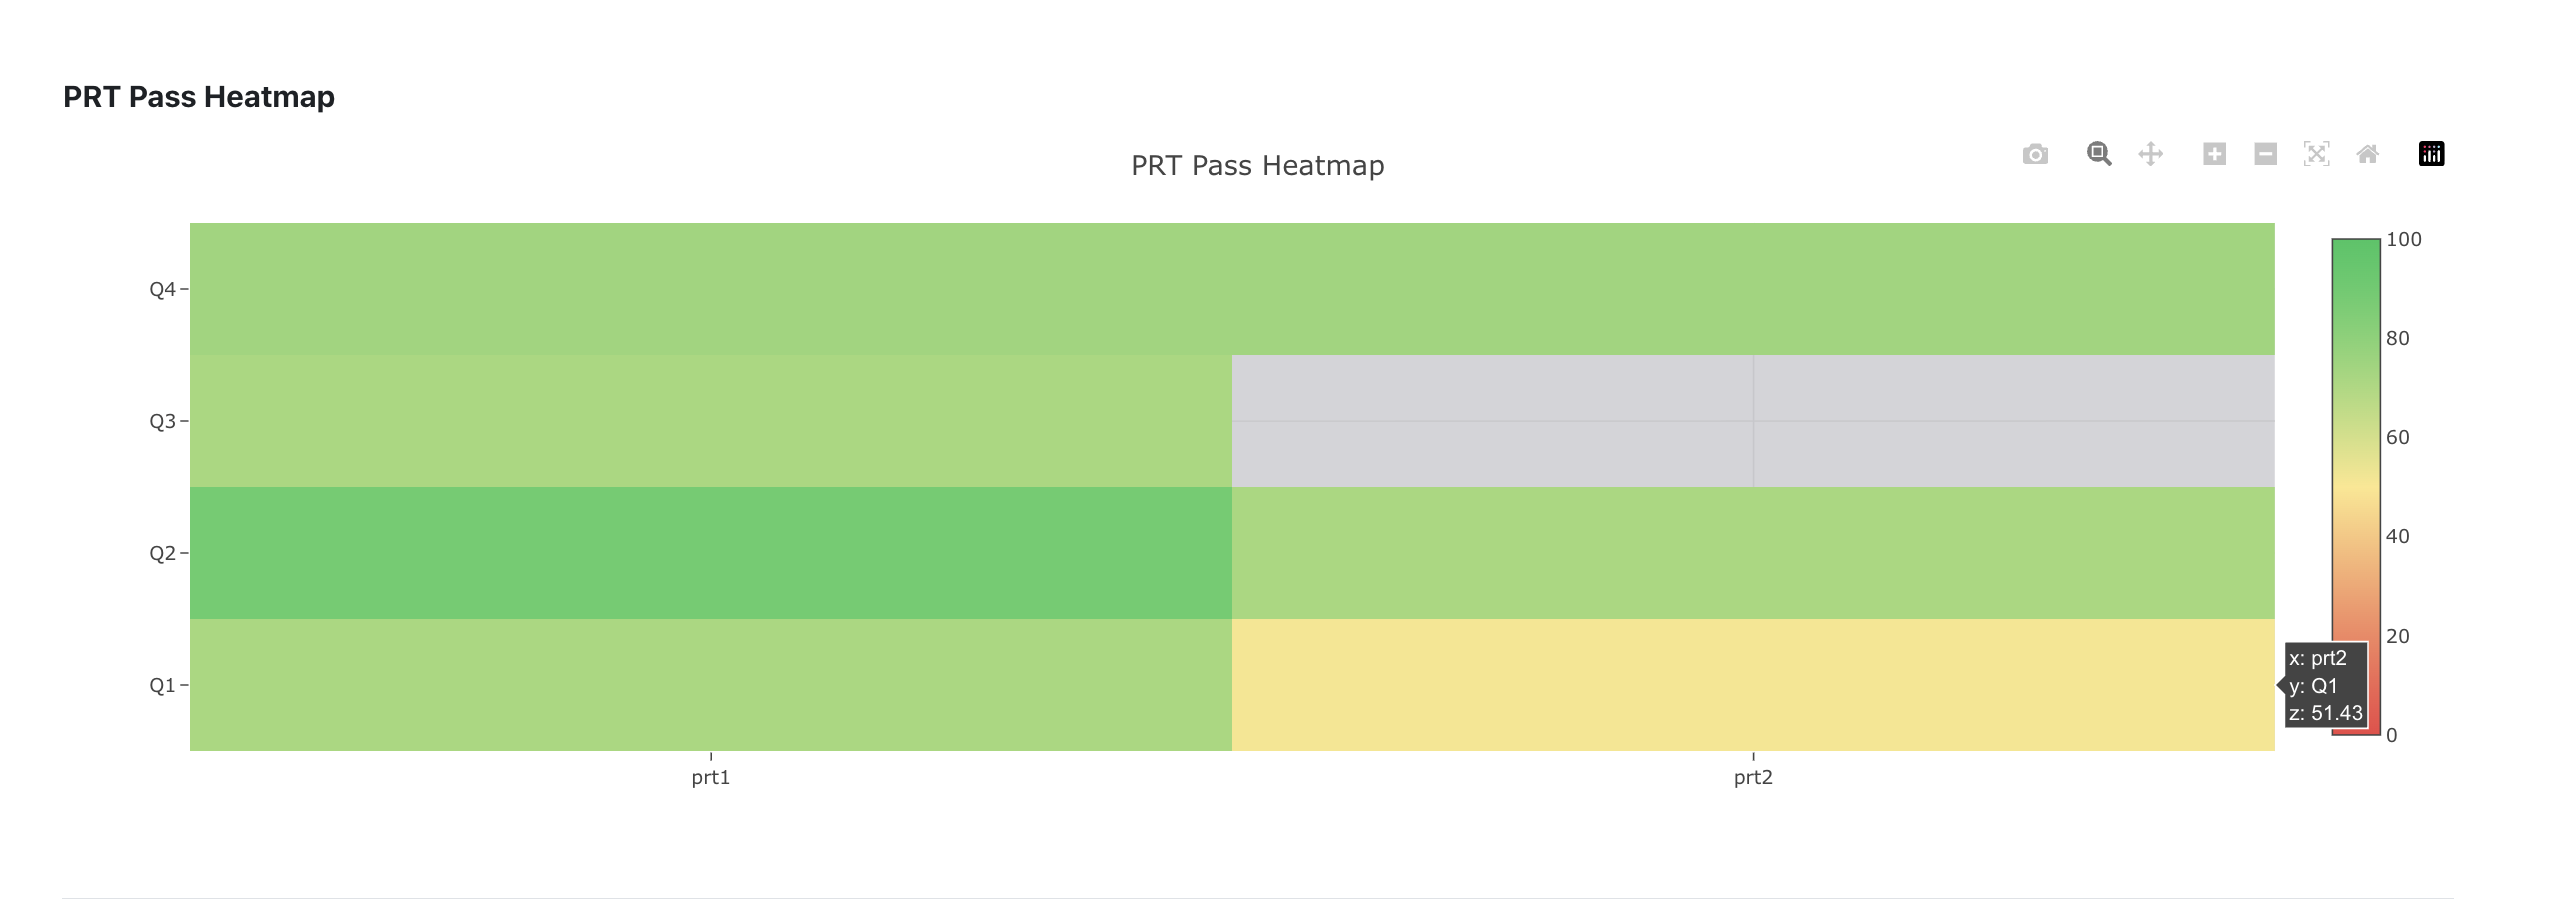
- Question Analytics — per quiz: difficulty and discrimination indices, response outcome distribution, a student performance matrix, consolidated question metrics, and a per-question error drill-down showing exactly what each student submitted next to the correct answer. Also includes
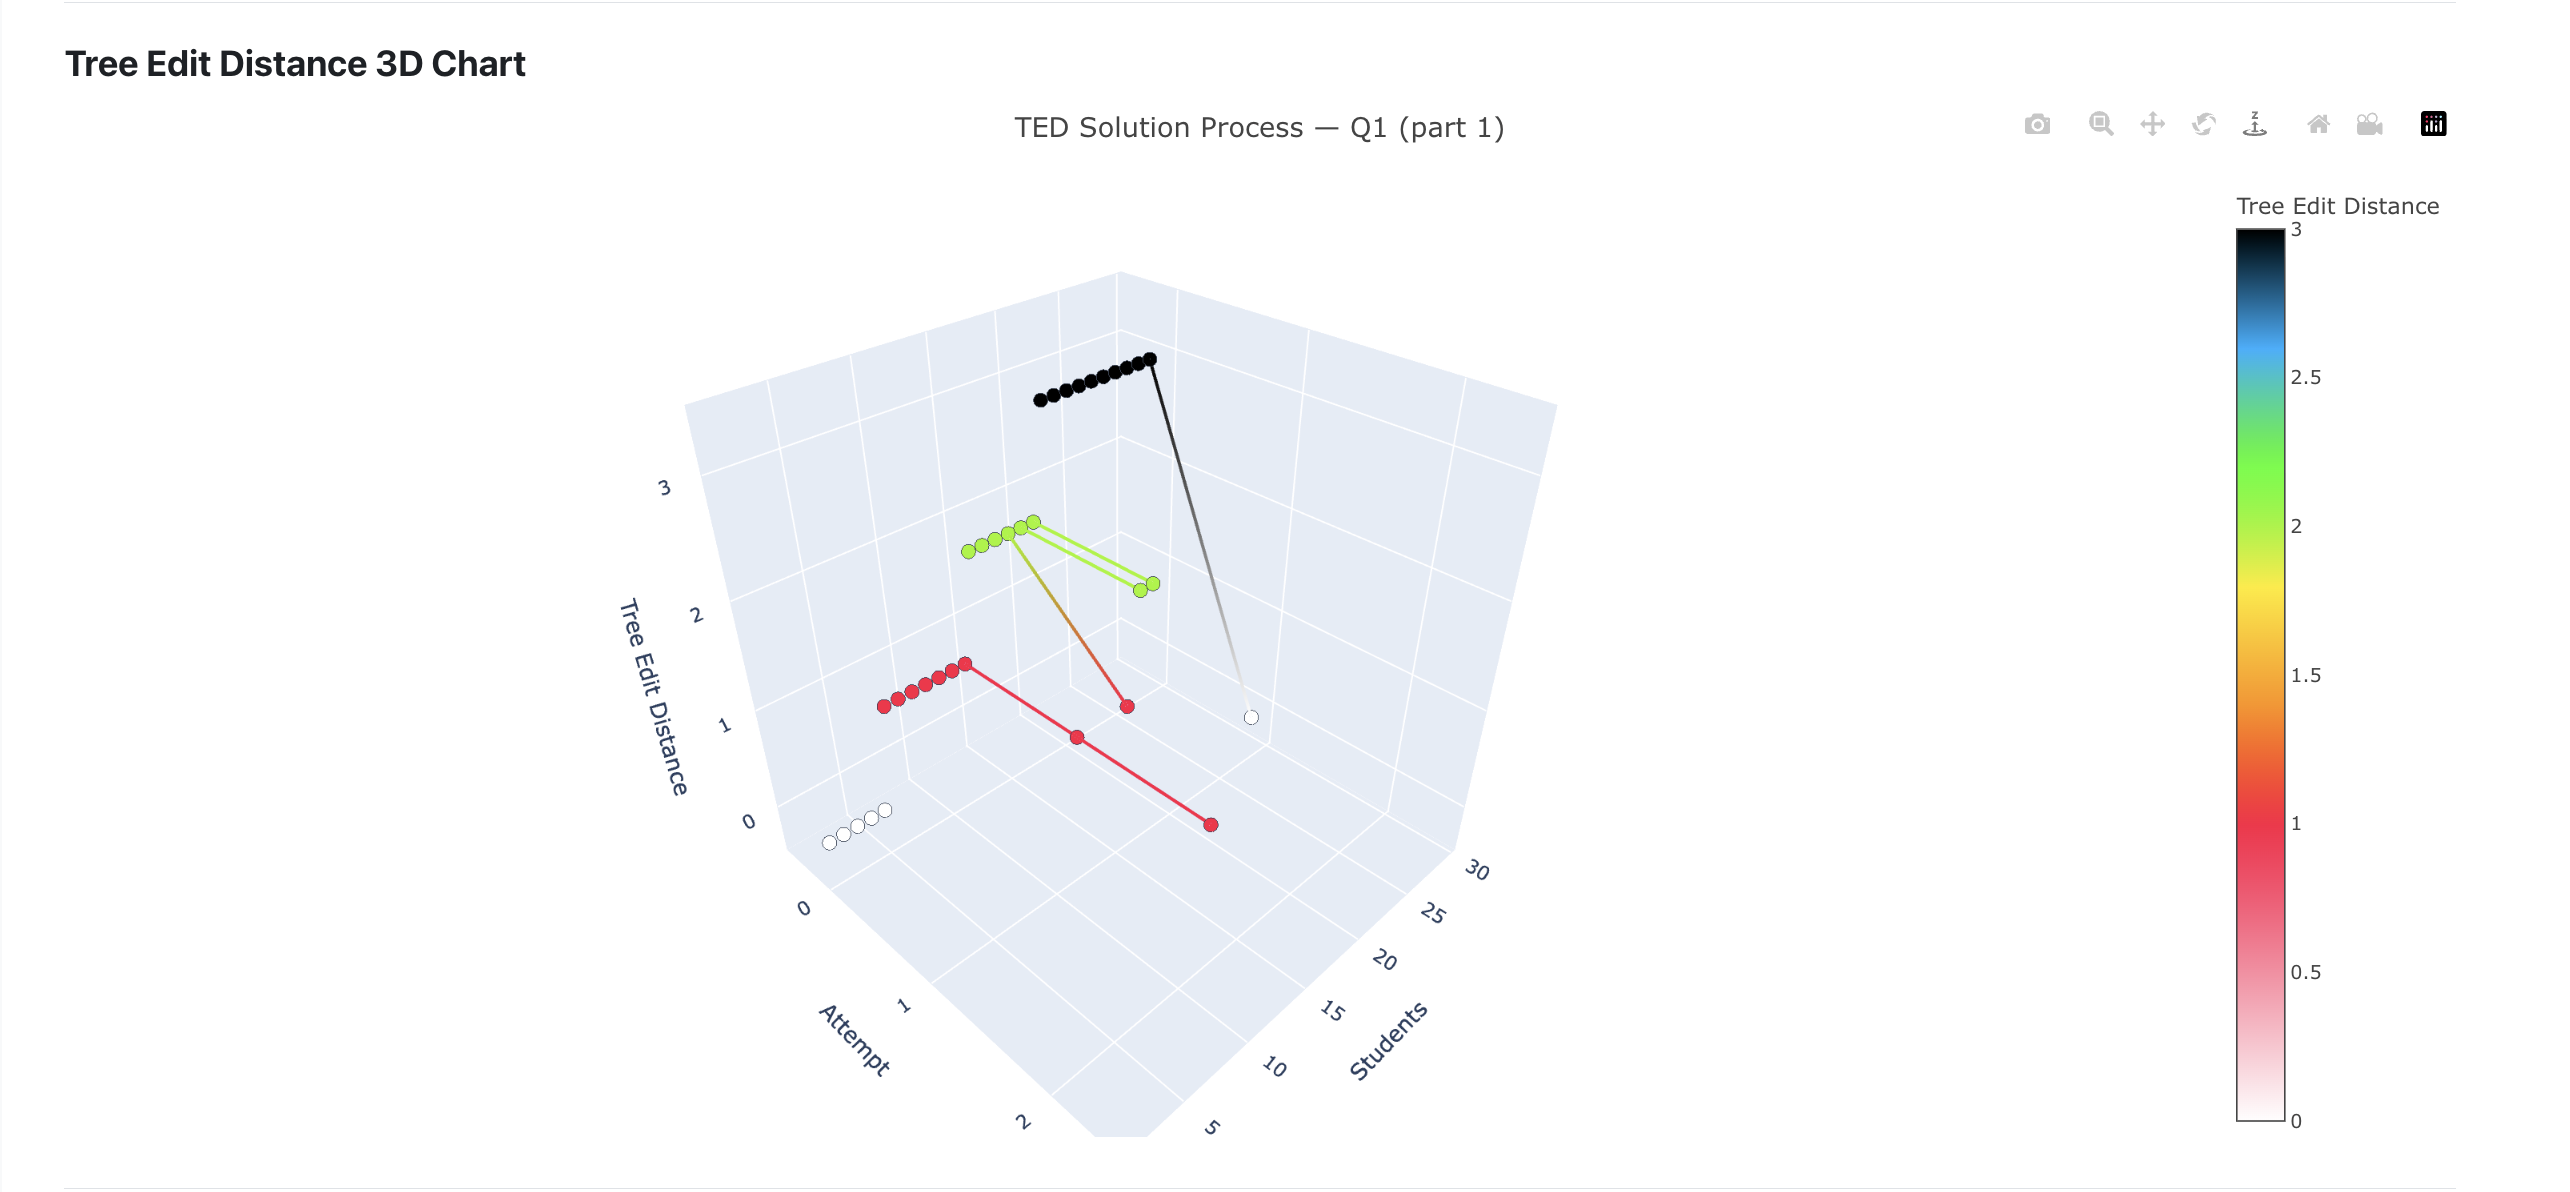
- Solution Process Visualization: class-wide answer transition graphs showing how students moved through a question's Potential Response Tree, per-node network centrality, 3D charts plotting each student's distance from the correct answer across attempts, and a cross-attempt comparison highlighting who improved, stayed flat, or regressed. PDF export on every view in both of these sections, with section checkboxes, a colorblind mode, and an anonymize-student-data toggle.
- Model Analytics — built on Moodle's own Analytics API.
- Model 1 (Student risk): a target predicting whether a student is at risk of not achieving course success, fed by five behavioral indicators (grade trajectory, response-latency anomaly, disengagement entropy, help-seeking gap, feedback-revision distance).
- Model 2 (Question/PRT review): a target predicting whether a STACK question's Potential Response Tree needs instructor review, fed by four indicators (IRT-inspired difficulty, syntax-error rate, unreached-node ratio, feedback- ineffectiveness). Both models ship disabled by default. What this section shows is each model's live indicator reading, not a trained prediction, until an administrator reviews the thresholds and enables/trains a model under Site Administration → Analytics → Models.
- Diagnostics Analytics — seed-bias (one-way ANOVA) and PRT branch-coverage reports, kept outside the ML pipeline since they have no natural ground-truth label: direct calculations, not model predictions. PDF export re-derives whichever sections are ticked, in both Model Analytics and Diagnostics Analytics, as a landscape report.
- One "Analytics" nav entry (reachable from a course's own navigation, and from an "Analytics" link this plugin adds directly to each STACK quiz's own settings menu) with a "Section:" switcher between all four sections at the top of every page — previously two separate plugins, now one install.
- No external services, subscriptions, or API keys of any kind. Every computation runs in-process in plain PHP, and nothing ever leaves the Moodle server.
- Requires `qtype_stack` (the STACK question type) to have anything to show.
- Credit to Chris Sangwin for the development of STACK (https://marketplace.moodle.com/plugins/2120)
- Credit to Juma Zevick Otieno for the support and original work
- Credit to Nakamura et al. for the Solution Process Visualization work