Plugins ActiveProLearn
Lead maintainer
IMPORTANT NOTE FOR PLUGIN ARCHIVE AVAILABILITY
: due to the large amount of plugins supported, it is NOT affordable
for us to update moodle.org packages. Please use the Source Control urls
to our github to get plugins archives.
The dashboard element bloc is of use with flexible Moodle
page formats allowing free setup of the dashboard page layout using blocks.
It implements a "dashboard element" capable to plot and render in
many graphic output formats any result of a complex query presented
to the Moodle database (or an eventual external PostGre schema).
Given a full query, the dashboard block mashes up :
- Data table output
+ Linear (records) data table
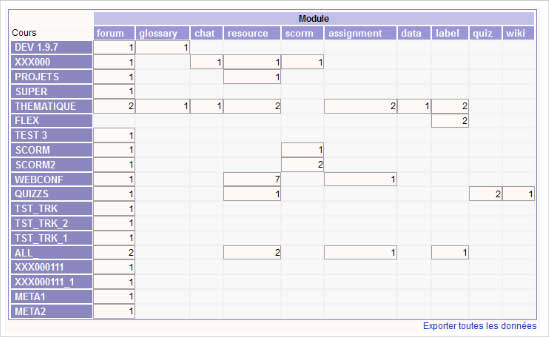
+ Tabular (cross dimension) tables
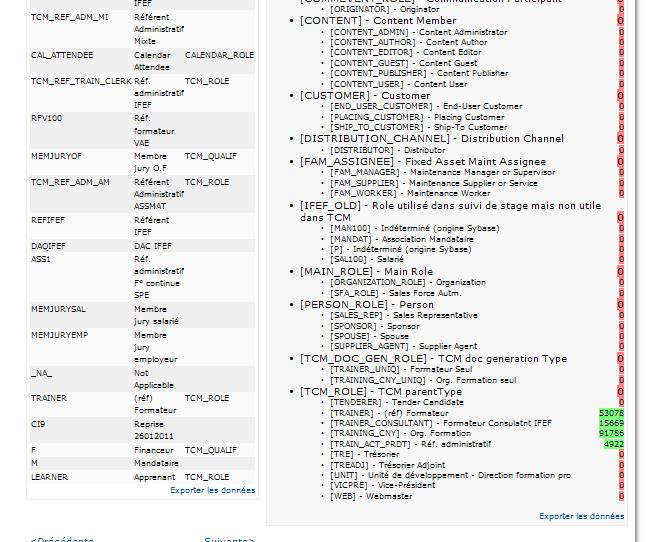
+ Treeview (on hierarchical mapped results)
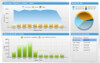
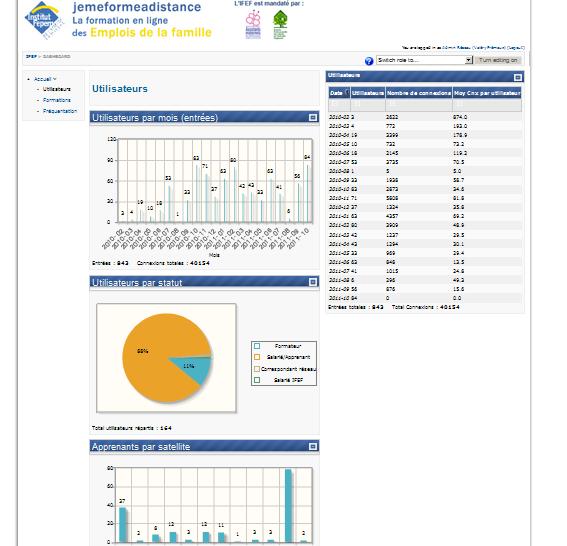
- Graphic plotting using JQPlot
+ Line graphs
+ Bar graphs
+ Pie graphs
+ Donuts graphs
- Geographic plotting (using GoogleMaps API)
+ Google Maps + query data plotting
+ Possibility to change icons and plor mutiple class data using course files
+ Geocoding requests to Google handled (up to 2500 per day) with static long term caching
=> Will evolve
- Time special plotting : Integrating SIMILE Timeline plugin
+ Plot on a timeline plugin of "instant" and "time duration" events
+ possibility of setting up color classes for events
+ possibility to customize "instant" pin icons from course files
=> Will evolve
- Data output additional features
+ Data output formatting (using sprintf formatting)
+ Filters (selecting output or query fields for filtering)
+ Summators : displaying computed sums of output fields
+ Cumulative mode : Produces cumulative sum of a field without extra query
+ Data colouring and marking (on tables) using comparison formulas (ex: %% == 0 )
+ Mappable Labels for ALL query field names
- Performance features
+ Result caching (programmable retension delay)
+ Croned refresh of cache
+ Instance adjustable refresh mode or global cron settings
Dependancies :
You will need to add the custom extra libraries additions from https://github.com/vfremaux/moodle-local_vflibs to get the plotter libraries.
Get the adequate branch for your major Moodle version and install the libraries as a moodle/local component.