Dashboard
Versions
Current version
3.0.0 (build 2016032400) (2016032400)
3.0.0 (build 2016032400)
Plugin type: Blocks
Frankenstyle component name: block_dashboard
Version build number: 2016032400
Version release name: 3.0.0 (build 2016032400)
Maturity: Release Candidate
Supported Moodle versions: 3.0
Repository URL (Git): http://github.com/vfremaux/moodle-block_dashboard
Repository branch: MOODLE_30_STABLE
Repository tag:
Issue/bug tracker URL: http://github.com/vfremaux/moodle-block_dashboard/issues
Versions
1.9 as branch MOODLE_19_STABLE (Status : RELEASE)
2.2 as branch master (Status : BETA)
Dashboard element block
the dashboard element block is of use with flexible Moodle
page formats allowing free setup of the page layout using blocks.
It implements a "dashboard element" capable to plot and render in
many graphic output formats any result of a complex query presented
to the Moodle database (or an eventual external PostGre schema).
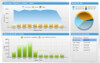
Given a full query, the dashboard block mashes up :
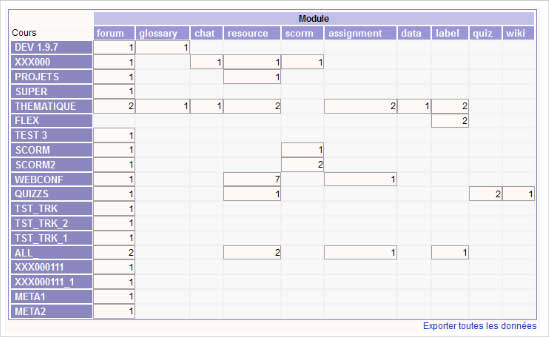
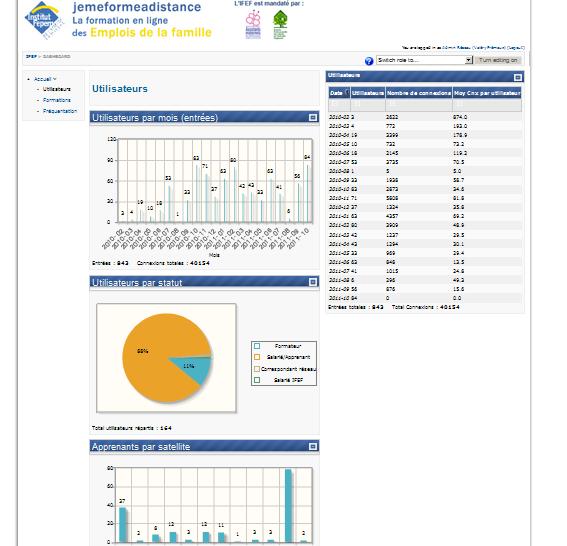
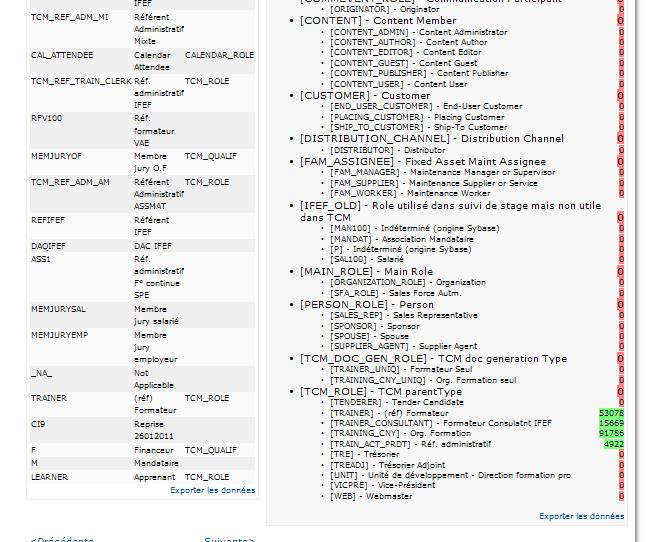
Data table output
- Linear (records) data table
- Tabular (cross dimension) tables
- Treeview (on hierarchical mapped results)
Graphic plotting using JQPlot
- Line graphs
- Bar graphs
- Pie graphs
- Donuts graphs
Geographic plotting (using GoogleMaps API)
- Google Maps + query data plotting
- Possibility to change icons and plor mutiple class data using course files
- Geocoding requests to Google handled (up to 2500 per day) with static long term caching
=> Will evolve
Time special plotting : Integrating SIMILE Timeline plugin
- Plot on a timeline plugin of "instant" and "time duration" events
- possibility of setting up color classes for events
- possibility to customize "instant" pin icons from course files
=> Will evolve
Data output additional features
- Data output formatting (using sprintf formatting)
- Filters (selecting output or query fields for filtering)
- Summators : displaying computed sums of output fields
- Cumulative mode : Produces cumulative sum of a field without extra query
- Data colouring and marking (on tables) using comparison formulas (ex: %% == 0 )
- Mappable Labels for ALL query field names
Performance features
- Result caching (programmable retension delay)
- Croned refresh of cache
- Instance adjustable refresh mode or global cron settings
Install
#########
Deploy the block in Moodle/blocks as usual
Activate notifications to install the data model
Create a course, better a flexipage or paged format course if available
Add a Dashboard block and write a query
Define output fields, output modes, output labels... and discover features....
Library locations
########################################
Get the VFLibs libraries package at https://github.com/vfremaux/moodle-local_vflibs/archive/MOODLE_30_STABLE.zip
and add the content to the moodle/local directory
Those libs are NOT moodle libs but additional public opensource libraries i use in several components as
extra framework.
Install additive for running timelines
========================================
@TODO : Review this with better JS provisioning calls
Timeline needs to be post page loading activated. We got some issue to stack onload events
on body element. The solution is till now to add a late call to initialisation in footer :
Add this statement :
if (function_exists('timeline_initialize')) timeline_initialize();
As latest possible statement in footer.
Enjoy nice plotting...
2.9.0 (build 2015100900) (2015100900)
2.9.0 (build 2015100900)
Plugin type: Blocks
Frankenstyle component name: block_dashboard
Version build number: 2015100900
Version release name: 2.9.0 (build 2015100900)
Maturity: Release Candidate
Supported Moodle versions: 2.9
Repository URL (Git): http://github.com/vfremaux/moodle-block_dashboard
Repository branch: MOODLE_29_STABLE
Repository tag:
Issue/bug tracker URL: http://github.com/vfremaux/moodle-block_dashboard/issues
Versions
1.9 as branch MOODLE_19_STABLE (Status : RELEASE)
2.2 as branch master (Status : BETA)
Dashboard element block
the dashboard element block is of use with flexible Moodle
page formats allowing free setup of the page layout using blocks.
It implements a "dashboard element" capable to plot and render in
many graphic output formats any result of a complex query presented
to the Moodle database (or an eventual external PostGre schema).
Given a full query, the dashboard block mashes up :
Data table output
- Linear (records) data table
- Tabular (cross dimension) tables
- Treeview (on hierarchical mapped results)
Graphic plotting using JQPlot
- Line graphs
- Bar graphs
- Pie graphs
- Donuts graphs
Geographic plotting (using GoogleMaps API)
- Google Maps + query data plotting
- Possibility to change icons and plor mutiple class data using course files
- Geocoding requests to Google handled (up to 2500 per day) with static long term caching
=> Will evolve
Time special plotting : Integrating SIMILE Timeline plugin
- Plot on a timeline plugin of "instant" and "time duration" events
- possibility of setting up color classes for events
- possibility to customize "instant" pin icons from course files
=> Will evolve
Data output additional features
- Data output formatting (using sprintf formatting)
- Filters (selecting output or query fields for filtering)
- Summators : displaying computed sums of output fields
- Cumulative mode : Produces cumulative sum of a field without extra query
- Data colouring and marking (on tables) using comparison formulas (ex: %% == 0 )
- Mappable Labels for ALL query field names
Performance features
- Result caching (programmable retension delay)
- Croned refresh of cache
- Instance adjustable refresh mode or global cron settings
Install
#########
Deploy the block in Moodle/blocks as usual
Activate notifications to install the data model
Create a course, better a flexipage or paged format course if available
Add a Dashboard block and write a query
Define output fields, output modes, output labels... and discover features....
Library locations
########################################
Get the VFLibs libraries package at https://github.com/vfremaux/moodle-local_vflibs/archive/MOODLE_29_STABLE.zip
and add the content to the moodle/local directory
Those libs are NOT moodle libs but additional public opensource libraries i use in several components as
extra framework.
Install additive for running timelines
========================================
@TODO : Review this with better JS provisioning calls
Timeline needs to be post page loading activated. We got some issue to stack onload events
on body element. The solution is till now to add a late call to initialisation in footer :
Add this statement :
if (function_exists('timeline_initialize')) timeline_initialize();
As latest possible statement in footer.
Enjoy nice plotting...
2.5.0 (build 2013042500) (2013042501)
2.5.0 (build 2013042500)
Plugin type: Blocks
Frankenstyle component name: block_dashboard
Version build number: 2013042501
Version release name: 2.5.0 (build 2013042500)
Maturity: Beta
Supported Moodle versions: 2.5
Repository URL (Git): http://github.com/vfremaux/moodle-block_dashboard
Repository branch: MOODLE_25_STABLE
Repository tag:
Issue/bug tracker URL: http://github.com/vfremaux/moodle-block_dashboard/issues
Dashboard element block
##############################
the dashboard element bloc is of use with flexible Moodle
page formats allowing free setup of the page layout using blocks.
It implements a "dashboard element" capable to plot and render in
many graphic output formats any result of a complex query presented
to the Moodle database (or an eventual external PostGre schema).
Given a full query, the dashboard block mashes up :
Data table output
- Linear (records) data table
- Tabular (cross dimension) tables
- Treeview (on hierarchical mapped results)
Graphic plotting using JQPlot
- Line graphs
- Bar graphs
- Pie graphs
- Donuts graphs
Geographic plotting (using GoogleMaps API)
- Google Maps + query data plotting
- Possibility to change icons and plor mutiple class data using course files
- Geocoding requests to Google handled (up to 2500 per day) with static long term caching
=> Will evolve
Time special plotting : Integrating SIMILE Timeline plugin
- Plot on a timeline plugin of "instant" and "time duration" events
- possibility of setting up color classes for events
- possibility to customize "instant" pin icons from course files
=> Will evolve
Data output additional features
- Data output formatting (using sprintf formatting)
- Filters (selecting output or query fields for filtering)
- Summators : displaying computed sums of output fields
- Cumulative mode : Produces cumulative sum of a field without extra query
- Data colouring and marking (on tables) using comparison formulas (ex: %% == 0 )
- Mappable Labels for ALL query field names
Performance features
- Result caching (programmable retension delay)
- Croned refresh of cache
- Instance adjustable refresh mode or global cron settings
Install
#########
Deploy the block in Moodle/blocks as usual
Activate notifications to install the data model
Create a course, better a flexipage or paged format course if available
Add a Dashboard block and write a query
Define output fields, output modes, output labels... and discover features....
Library locations
########################################
Libraries will work from inside the block dashboard.
A further version might propose to move them into a "shared libs framework" local plugin for code packaging optimisation.
Install additive for running timelines
########################################
Timeline needs to be post page loading activaed. We got some issue to stack onload events
on body element. The solution is till now to add a late call to initialisation in footer :
Add this statement :
if (function_exists('timeline_initialize')) timeline_initialize();
As latest possible statement in footer.
Enjoy nice plotting...
2.2.0 (build 2012062100) (2012062100)
2.2.0 (build 2012062100)
Plugin type: Blocks
Frankenstyle component name: block_dashboard
Version build number: 2012062100
Version release name: 2.2.0 (build 2012062100)
Maturity: Beta
Supported Moodle versions: 2.2, 2.3
Repository URL (Git): http://github.com/vfremaux/moodle-block_dashboard
Repository branch: master
Repository tag:
Issue/bug tracker URL: http://github.com/vfremaux/moodle-block_dashboard/issues
Dashboard element block
##############################
Changes : fix database table names as being too long for XMLDB
fix french strings
moved help texts from help strigns to Moodle documentation
########
the dashboard element bloc is of use with flexible Moodle
page formats allowing free setup of the page layout using blocks.
It implements a "dashboard element" capable to plot and render in
many graphic output formats any result of a complex query presented
to the Moodle database (or an eventual external PostGre schema).
Given a full query, the dashboard block mashes up :
Data table output
- Linear (records) data table
- Tabular (cross dimension) tables
- Treeview (on hierarchical mapped results)
Graphic plotting using JQPlot
- Line graphs
- Bar graphs
- Pie graphs
- Donuts graphs
Geographic plotting (using GoogleMaps API)
- Google Maps + query data plotting
- Possibility to change icons and plor mutiple class data using course files
- Geocoding requests to Google handled (up to 2500 per day) with static long term caching
=> Will evolve
Time special plotting : Integrating SIMILE Timeline plugin
- Plot on a timeline plugin of "instant" and "time duration" events
- possibility of setting up color classes for events
- possibility to customize "instant" pin icons from course files
=> Will evolve
Data output additional features
- Data output formatting (using sprintf formatting)
- Filters (selecting output or query fields for filtering)
- Summators : displaying computed sums of output fields
- Cumulative mode : Produces cumulative sum of a field without extra query
- Data colouring and marking (on tables) using comparison formulas (ex: %% == 0 )
- Mappable Labels for ALL query field names
Performance features
- Result caching (programmable retension delay)
- Croned refresh of cache
- Instance adjustable refresh mode or global cron settings
Install
#########
Deploy the block in Moodle/blocks as usual
Activate notifications to isntall the data model
Create a course, better a flexipage or paged format course if available
Add a Dashboard block and write a query
Define output fields, output modes, output labels... and discover features....
Library locations
########################################
Libraries will work from inside the block dashboard.
A further version might propose to move them into a "shared libs framework" local plugin for code packaging optimisation.
Install additive for running timelines
########################################
Timeline needs to be post page loading activaed. We got some issue to stack onload events
on body element. The solution is till now to add a late call to initialisation in footer :
Add this statement :
if (function_exists('timeline_initialize')) timeline_initialize();
As latest possible statement in footer.
Enjoy nice plotting...
1.9 (build 2012061500) (2012061500)
1.9 (build 2012061500)
Plugin type: Blocks
Frankenstyle component name: block_dashboard
Version build number: 2012061500
Version release name: 1.9 (build 2012061500)
Maturity: Release Candidate
Supported Moodle versions: 1.9
Repository URL (Git): http://github.com/vfremaux/moodle-block_dashboard
Repository branch: MOODLE_19_STABLE
Repository tag:
Issue/bug tracker URL: http://github.com/vfremaux/moodle-block_dashboard/issues
Dashboard element block
##############################
the dashboard element bloc is of use with flexible Moodle
page formats allowing free setup of the page layout using blocks.
It implements a "dashboard element" capable to plot and render in
many graphic output formats any result of a complex query presented
to the Moodle database (or an eventual external PostGre schema).
Given a full query, the dashboard block mashes up :
Data table output
- Linear (records) data table
- Tabular (cross dimension) tables
- Treeview (on hierarchical mapped results)
Graphic plotting using JQPlot
- Line graphs
- Bar graphs
- Pie graphs
- Donuts graphs
Geographic plotting (using GoogleMaps API)
- Google Maps + query data plotting
- Possibility to change icons and plor mutiple class data using course files
- Geocoding requests to Google handled (up to 2500 per day) with static long term caching
=> Will evolve
Time special plotting : Integrating SIMILE Timeline plugin
- Plot on a timeline plugin of "instant" and "time duration" events
- possibility of setting up color classes for events
- possibility to customize "instant" pin icons from course files
=> Will evolve
Data output additional features
- Data output formatting (using sprintf formatting)
- Filters (selecting output or query fields for filtering)
- Summators : displaying computed sums of output fields
- Cumulative mode : Produces cumulative sum of a field without extra query
- Data colouring and marking (on tables) using comparison formulas (ex: %% == 0 )
- Mappable Labels for ALL query field names
Performance features
- Result caching (programmable retension delay)
- Croned refresh of cache
- Instance adjustable refresh mode or global cron settings
Install
#########
Deploy the block in Moodle/blocks as usual
Activate notifications to isntall the data model
Create a course, better a flexipage or paged format course if available
Add a Dashboard block and write a query
Define output fields, output modes, output labels... and discover features....
Library locations
########################################
Libraries will work from inside the block dashboard.
A further version might propose to move them into a "shared libs framework" local plugin for code packaging optimisation.
Install additive for running timelines
########################################
Timeline needs to be post page loading activaed. We got some issue to stack onload events
on body element. The solution is till now to add a late call to initialisation in footer :
Add this statement :
if (function_exists('timeline_initialize')) timeline_initialize();
As latest possible statement in footer.
Enjoy nice plotting...