Pimenko team
Lead maintainer
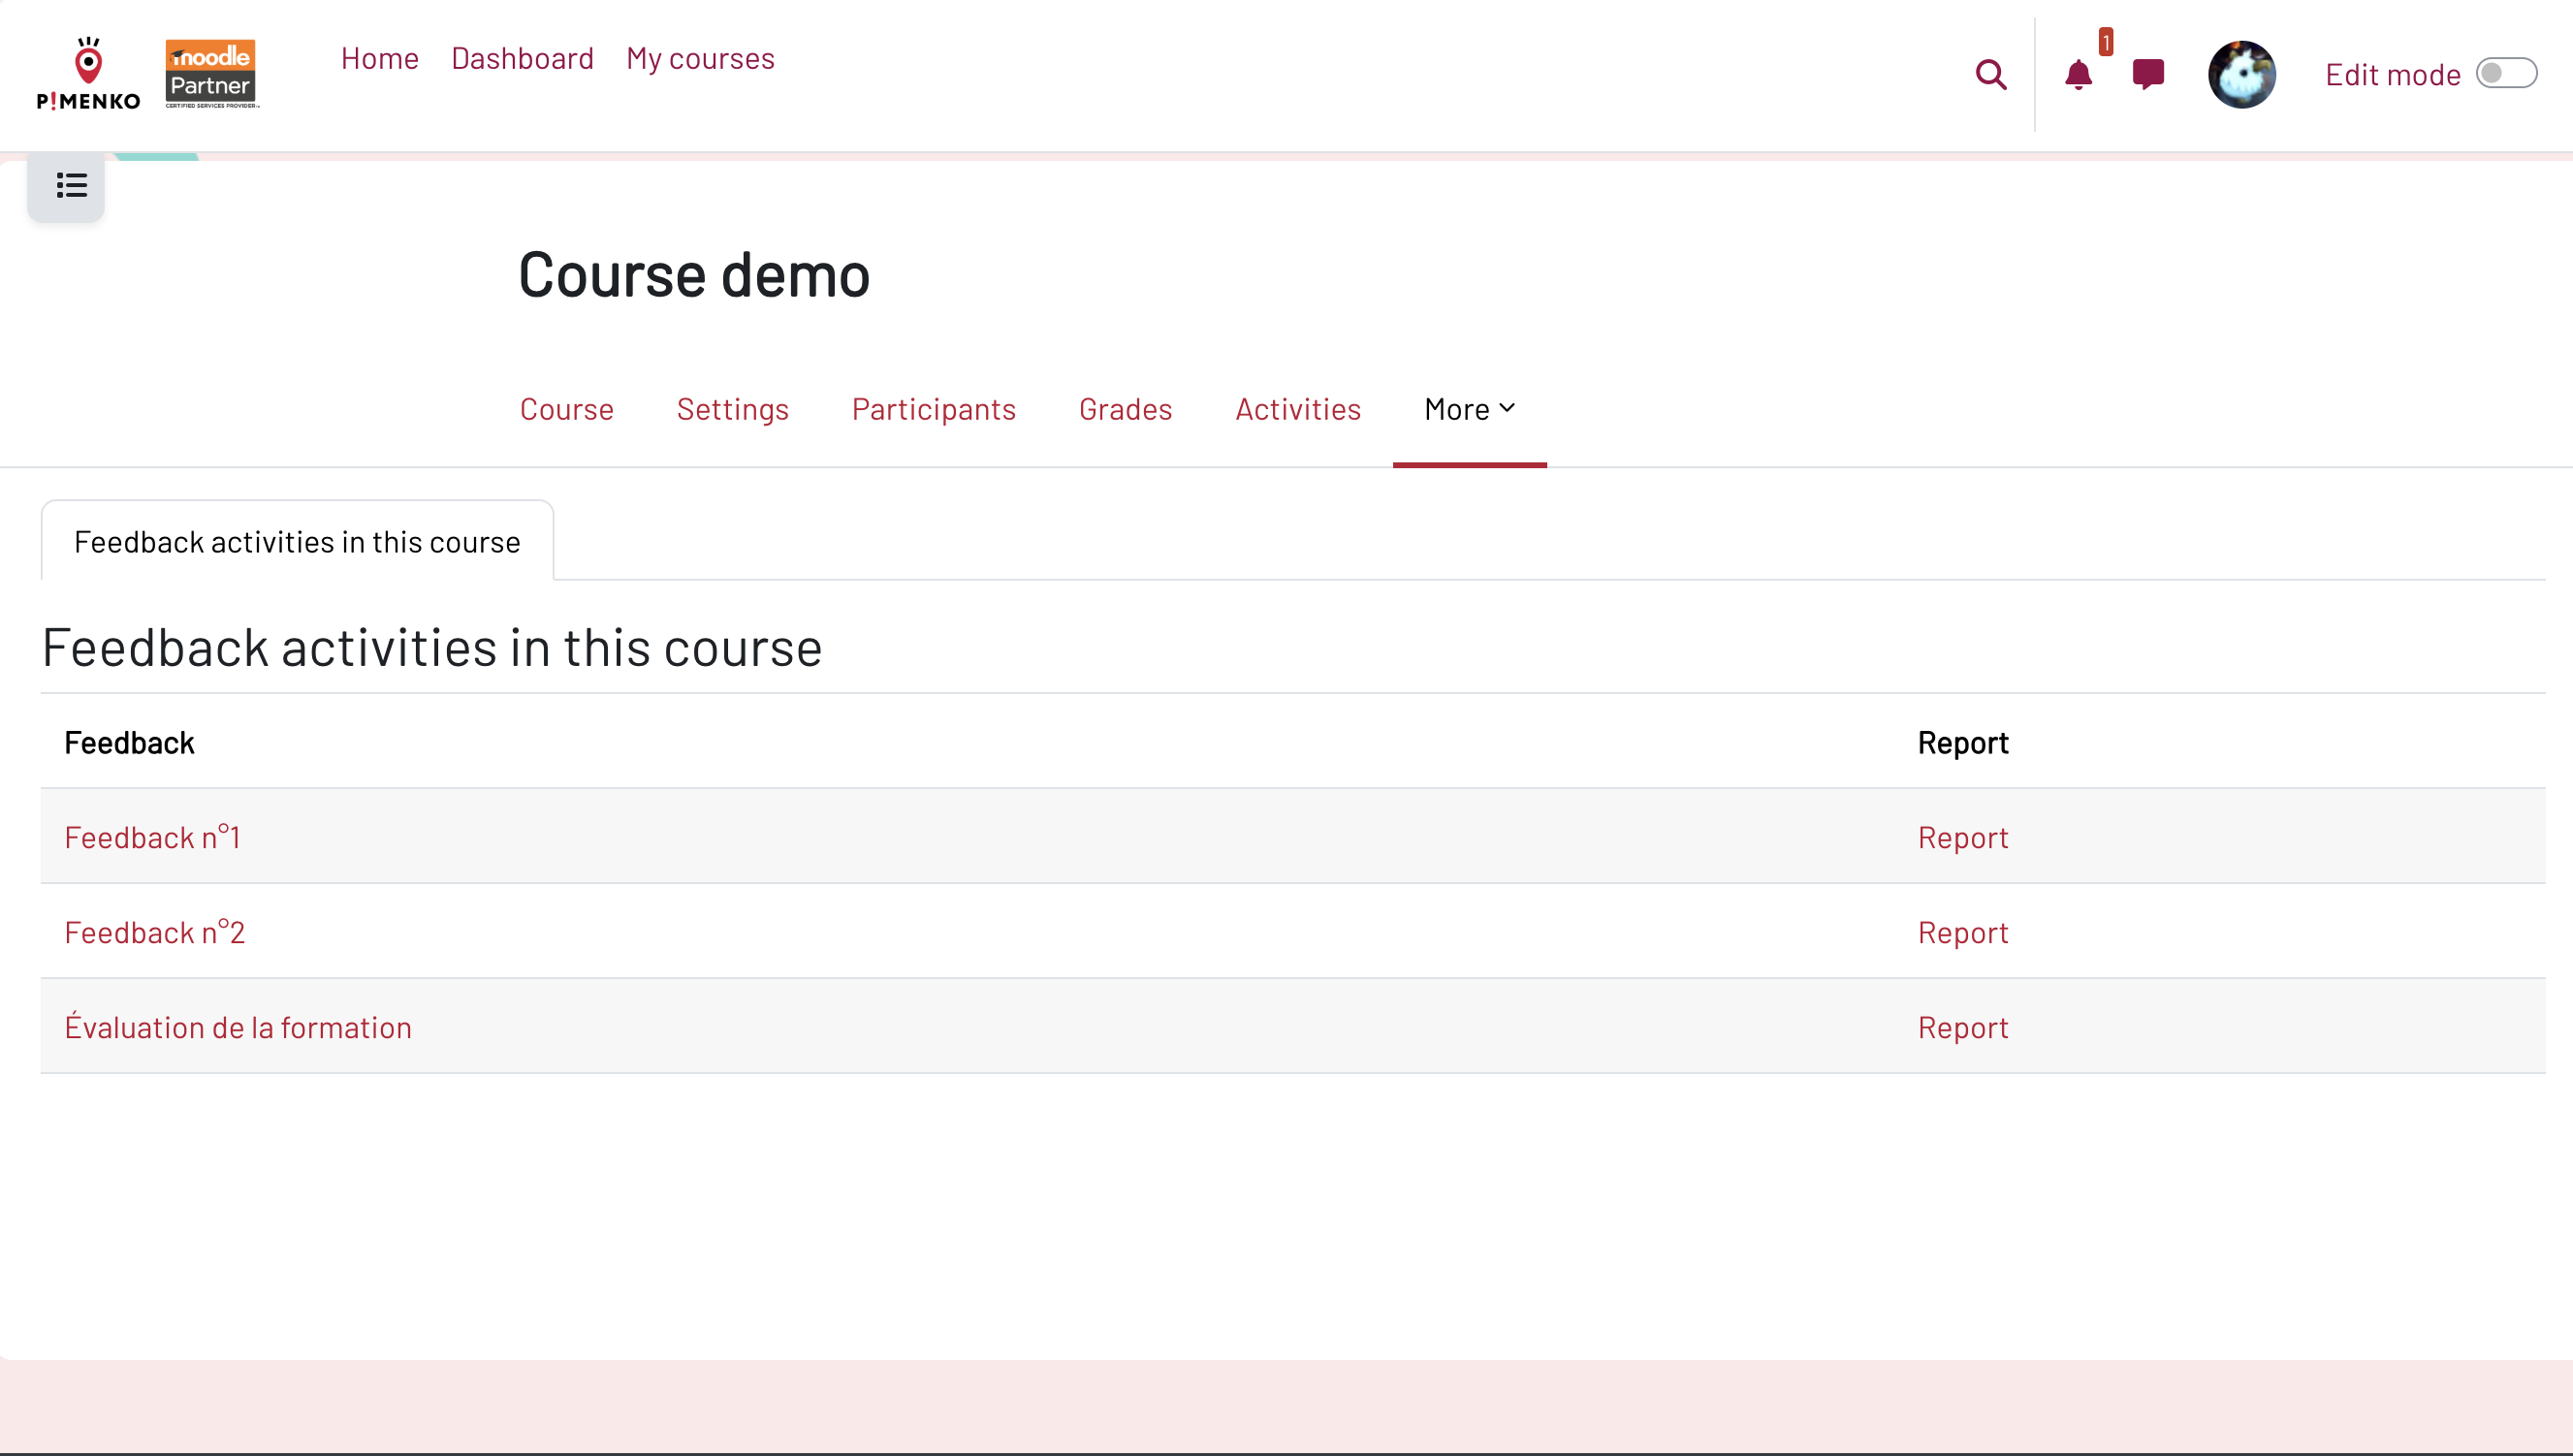
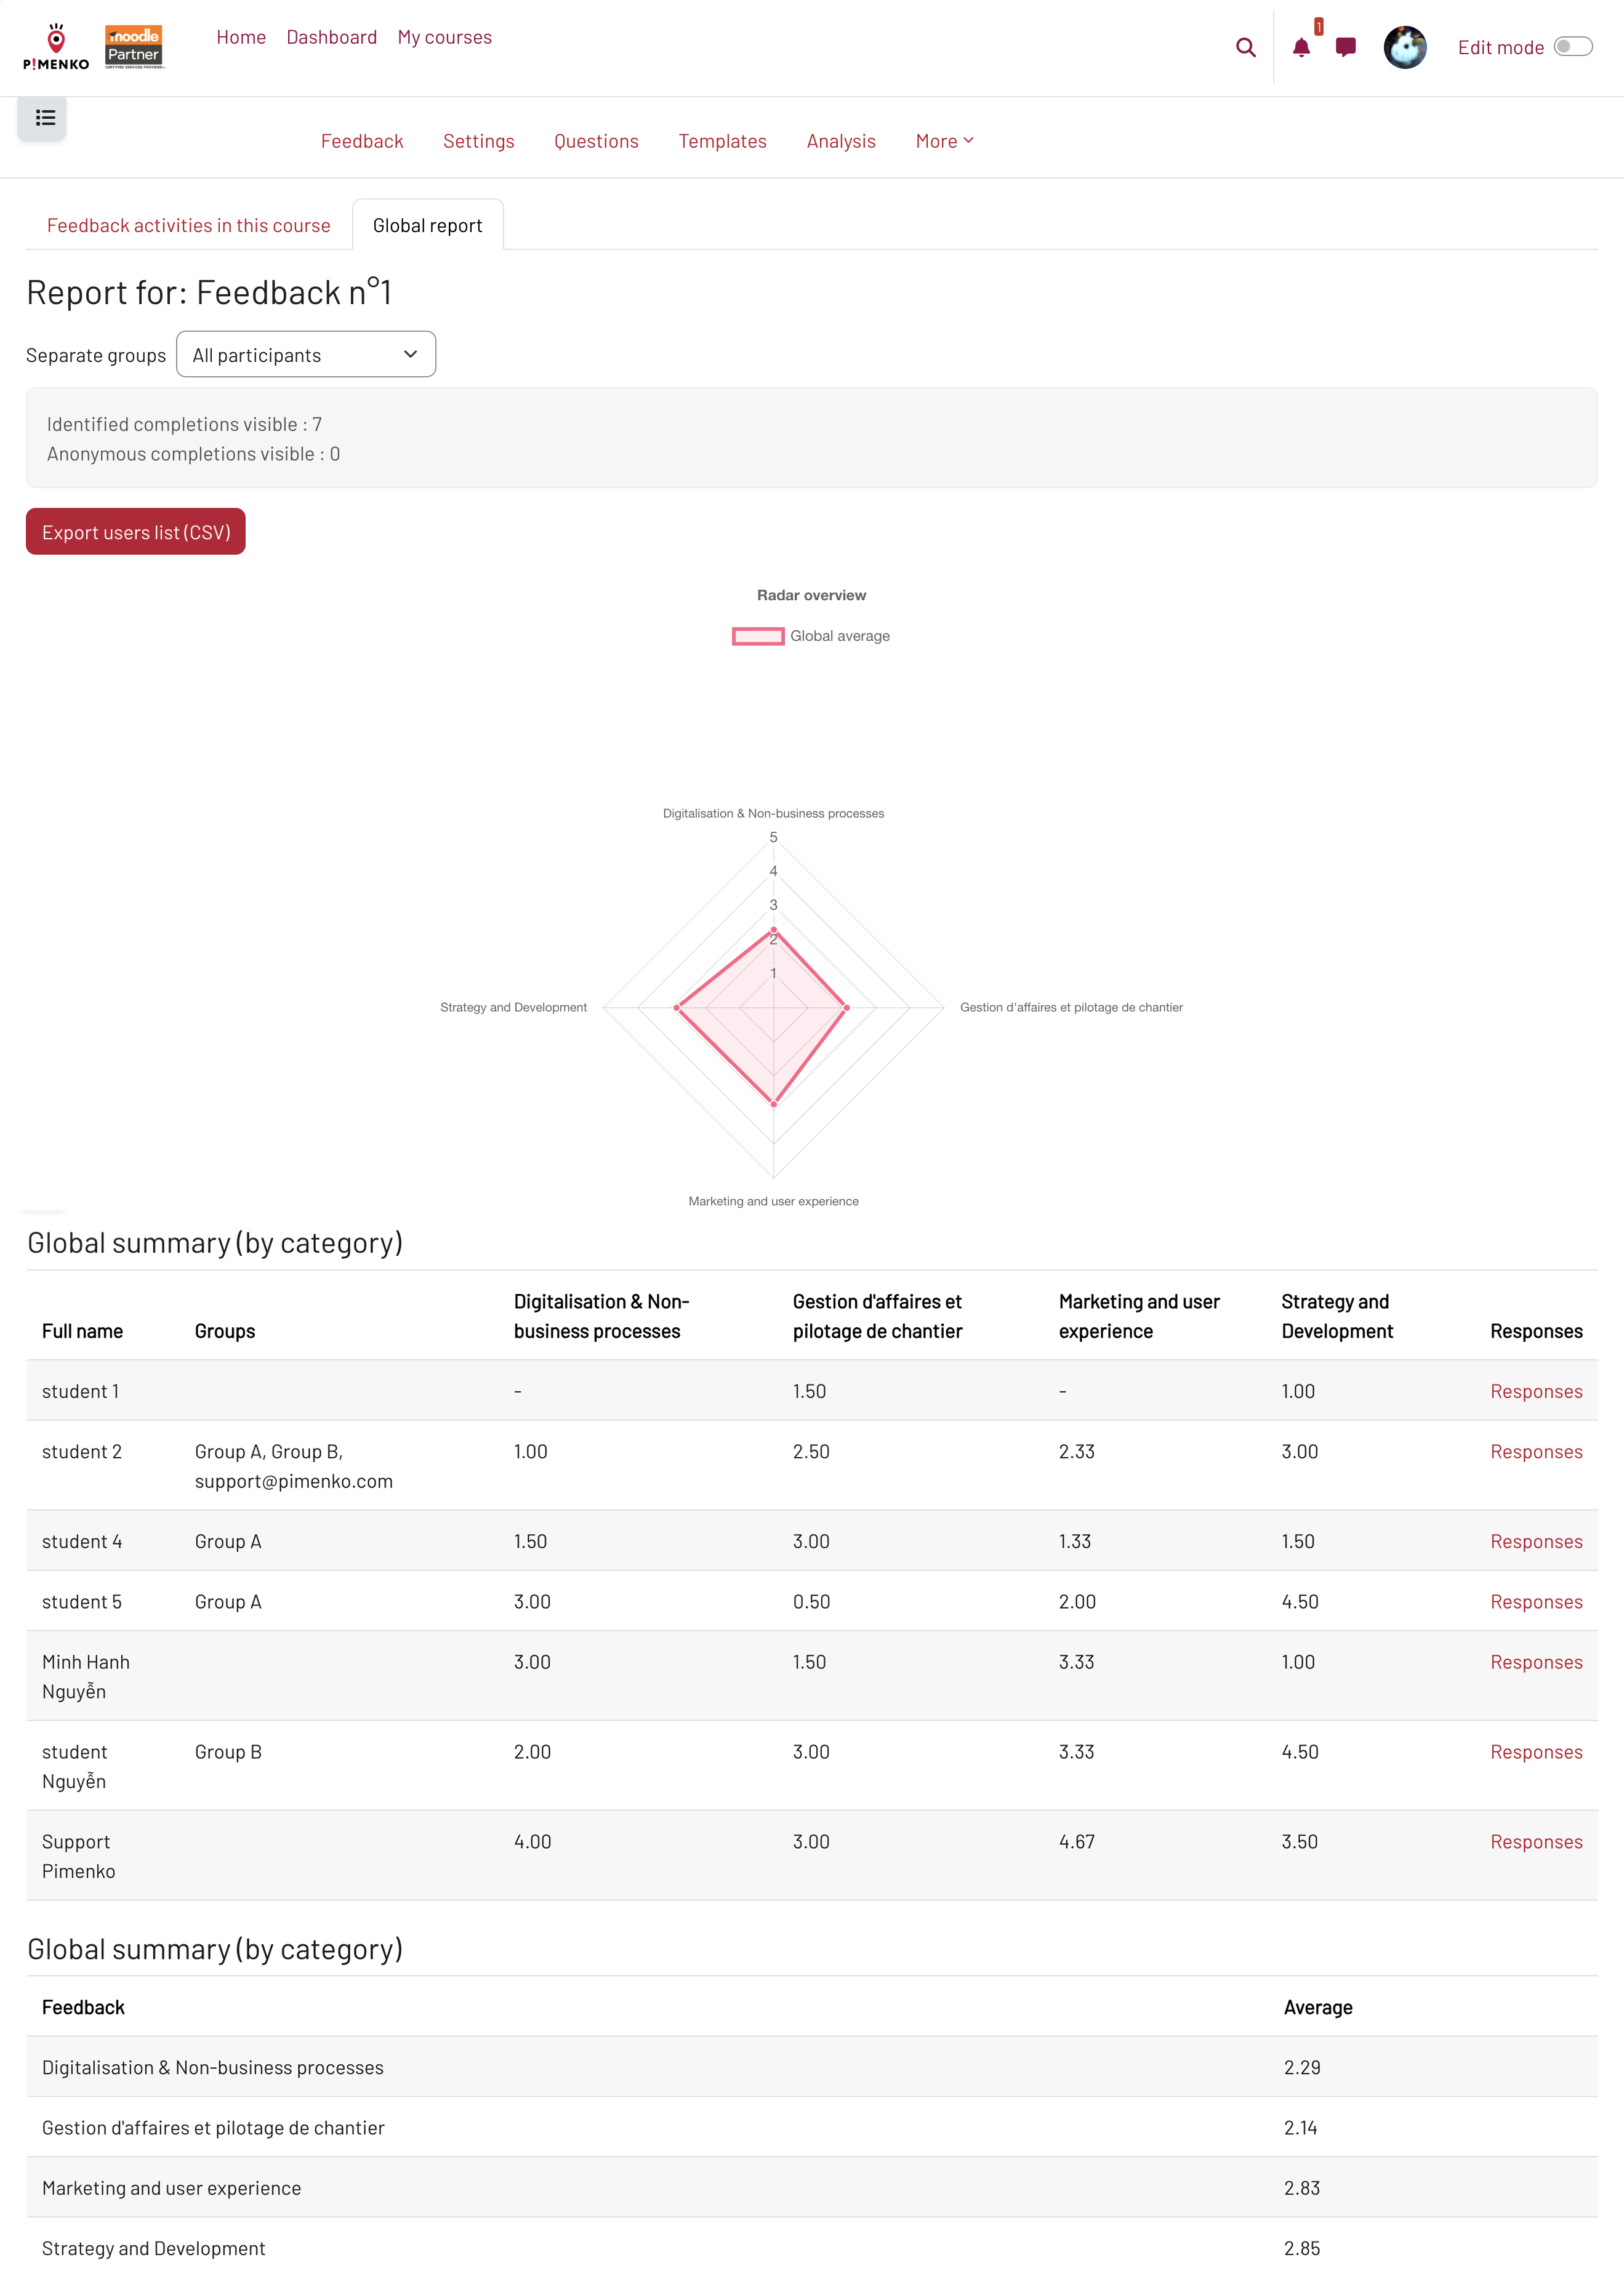
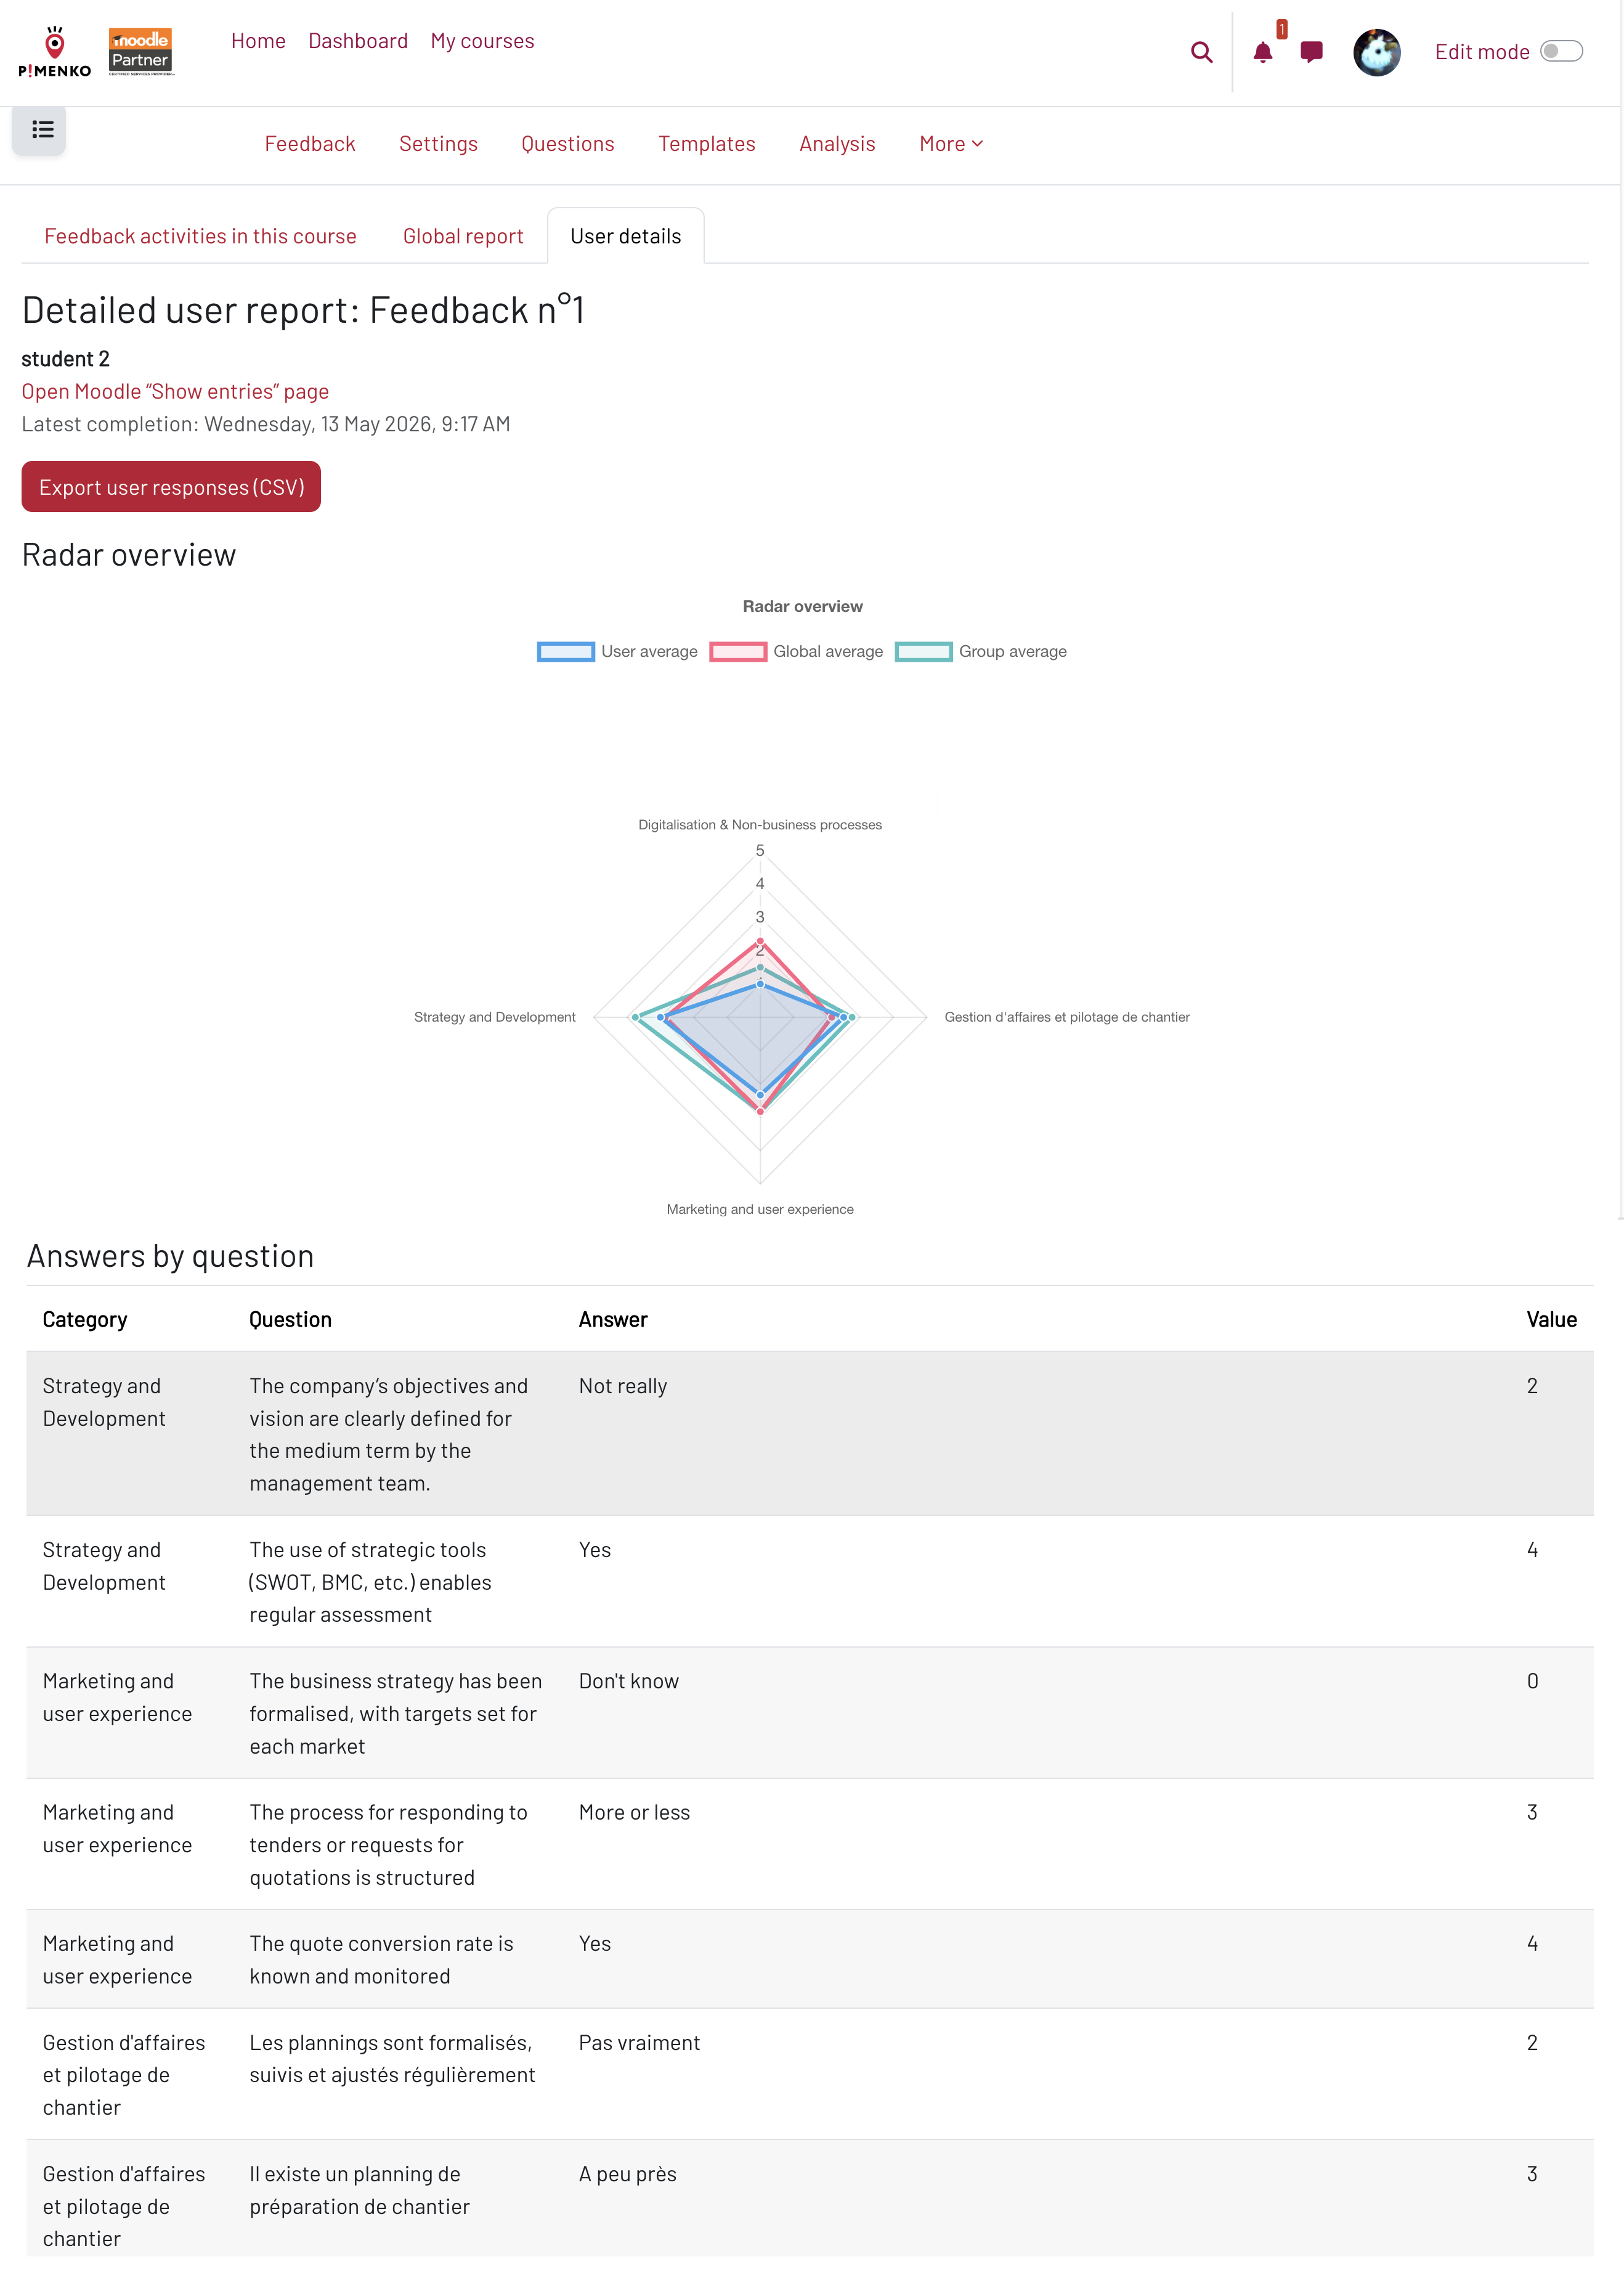
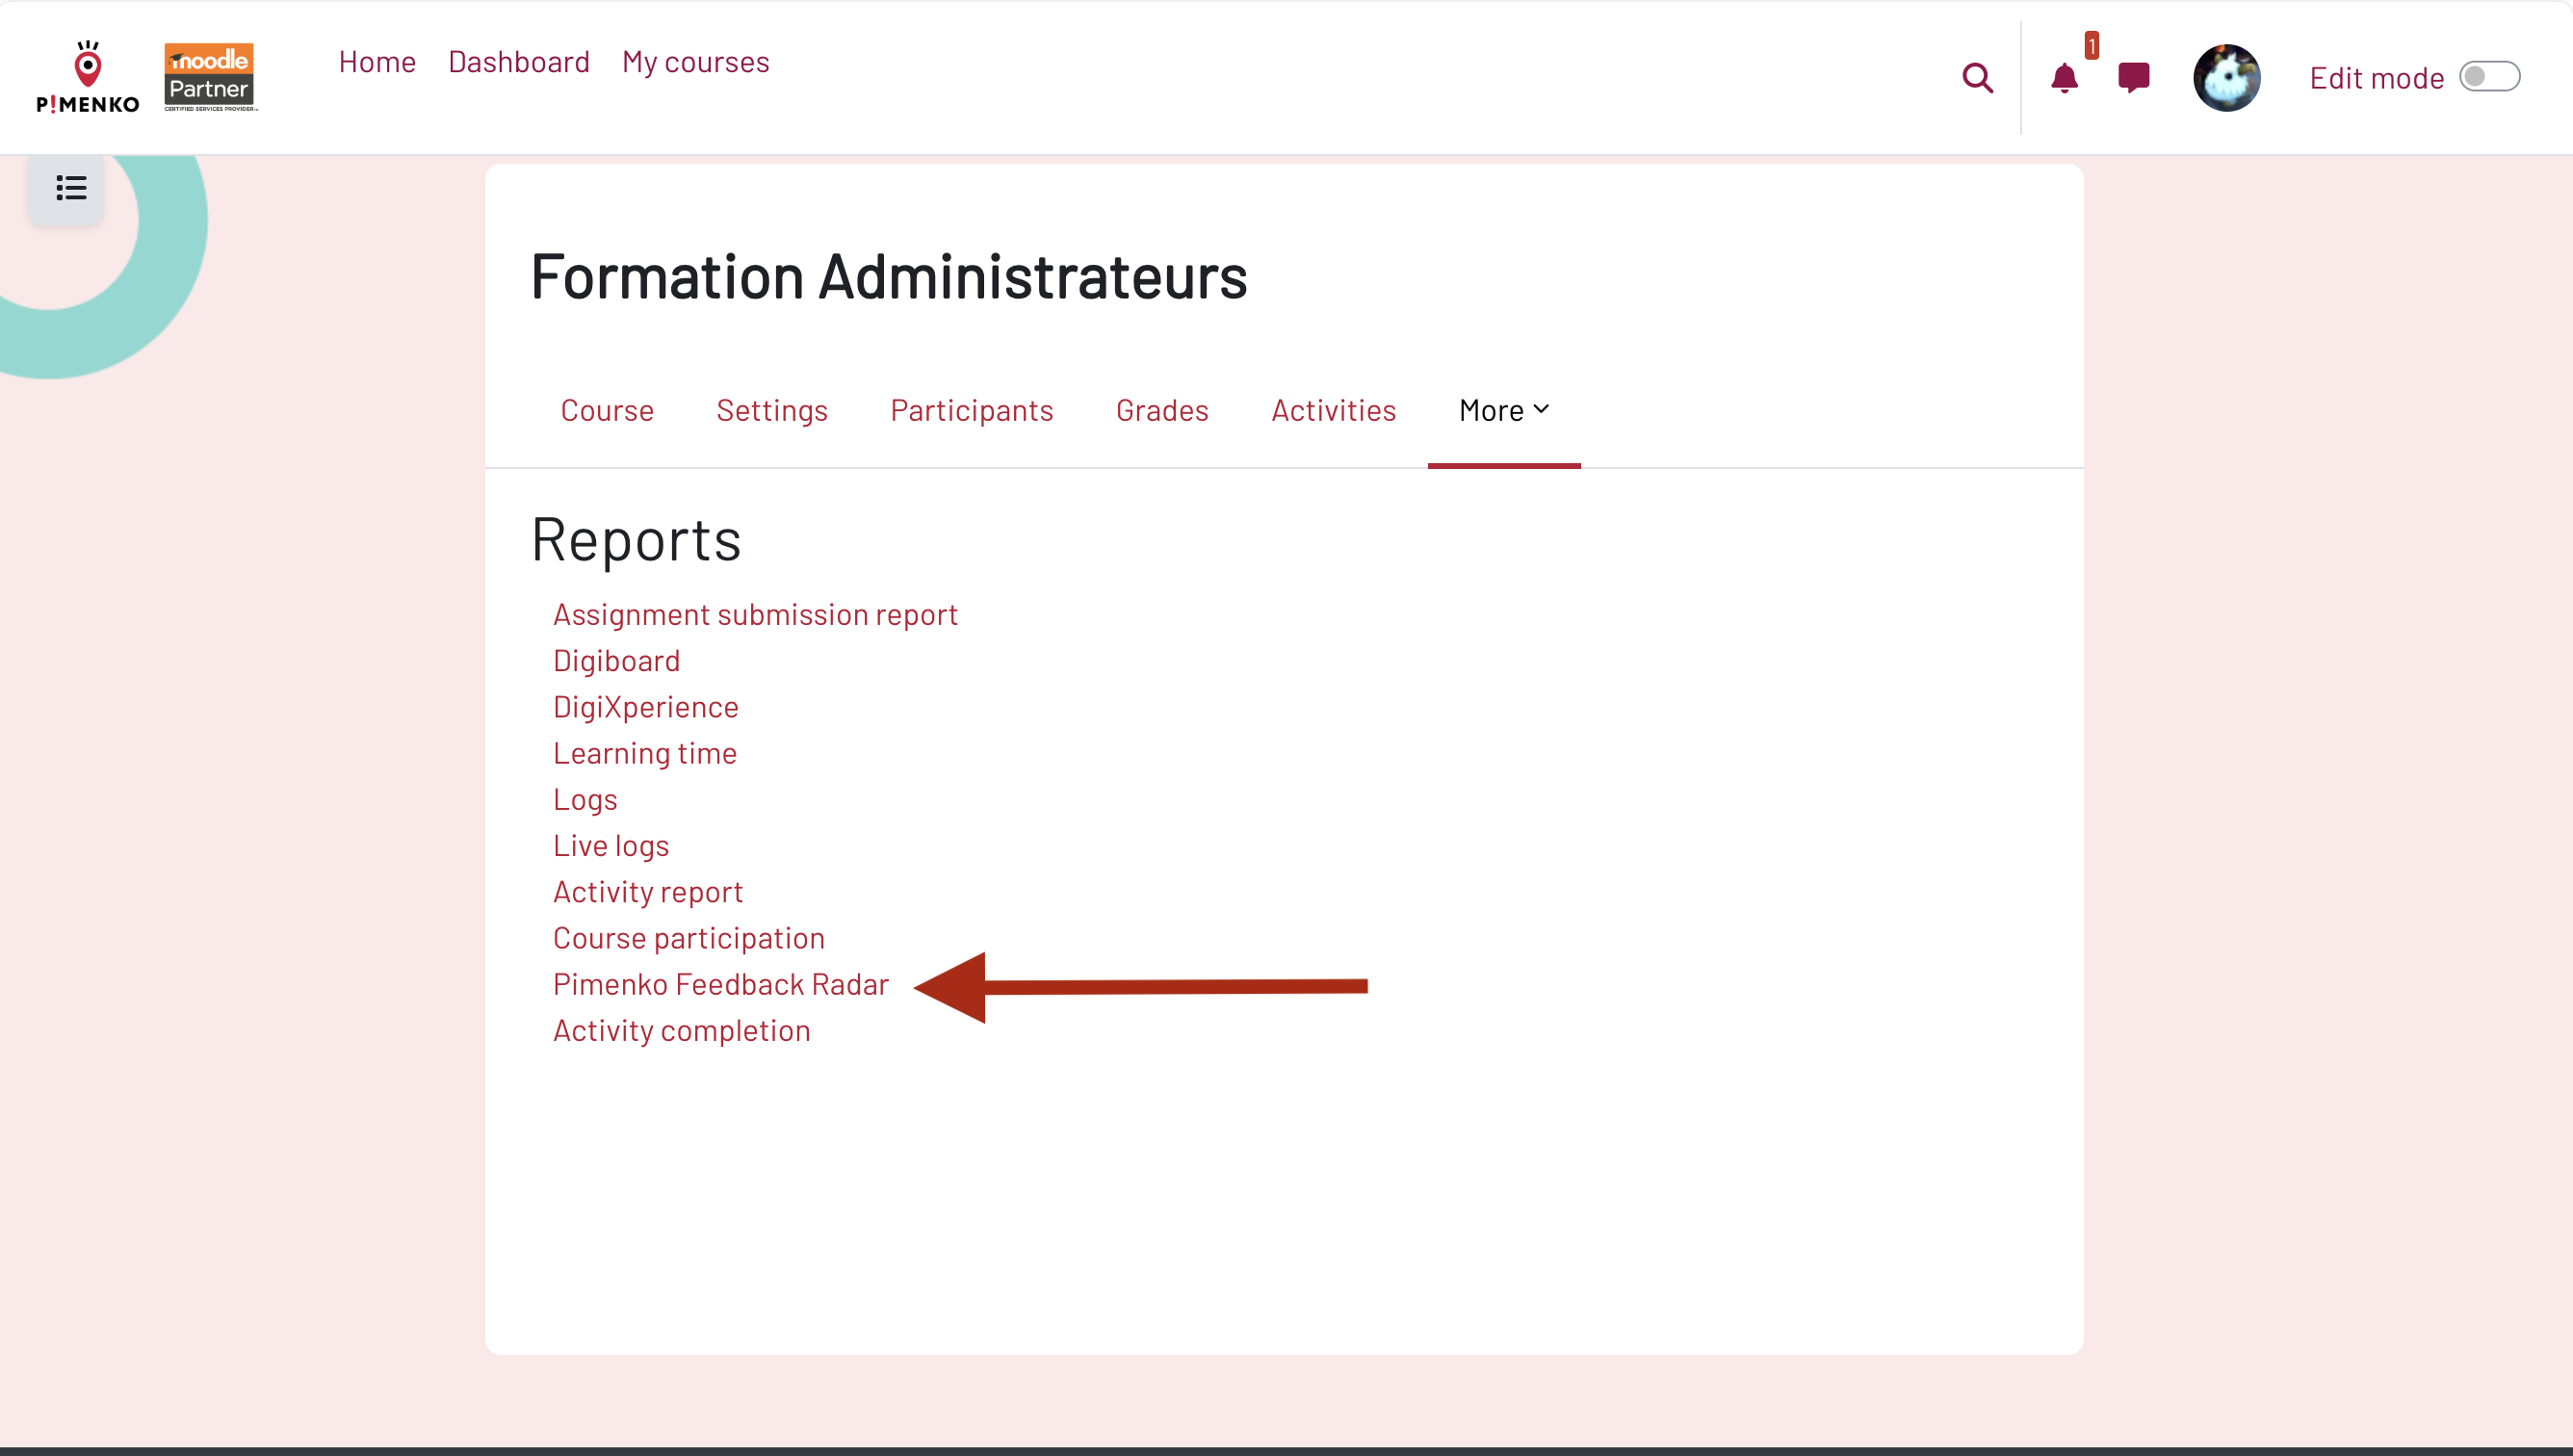
No more reading through flat question-by-question lists. Feedback Radar groups your rated questions by theme, calculates category averages automatically and displays everything as a radar chart — so you can spot strengths and gaps at a glance.
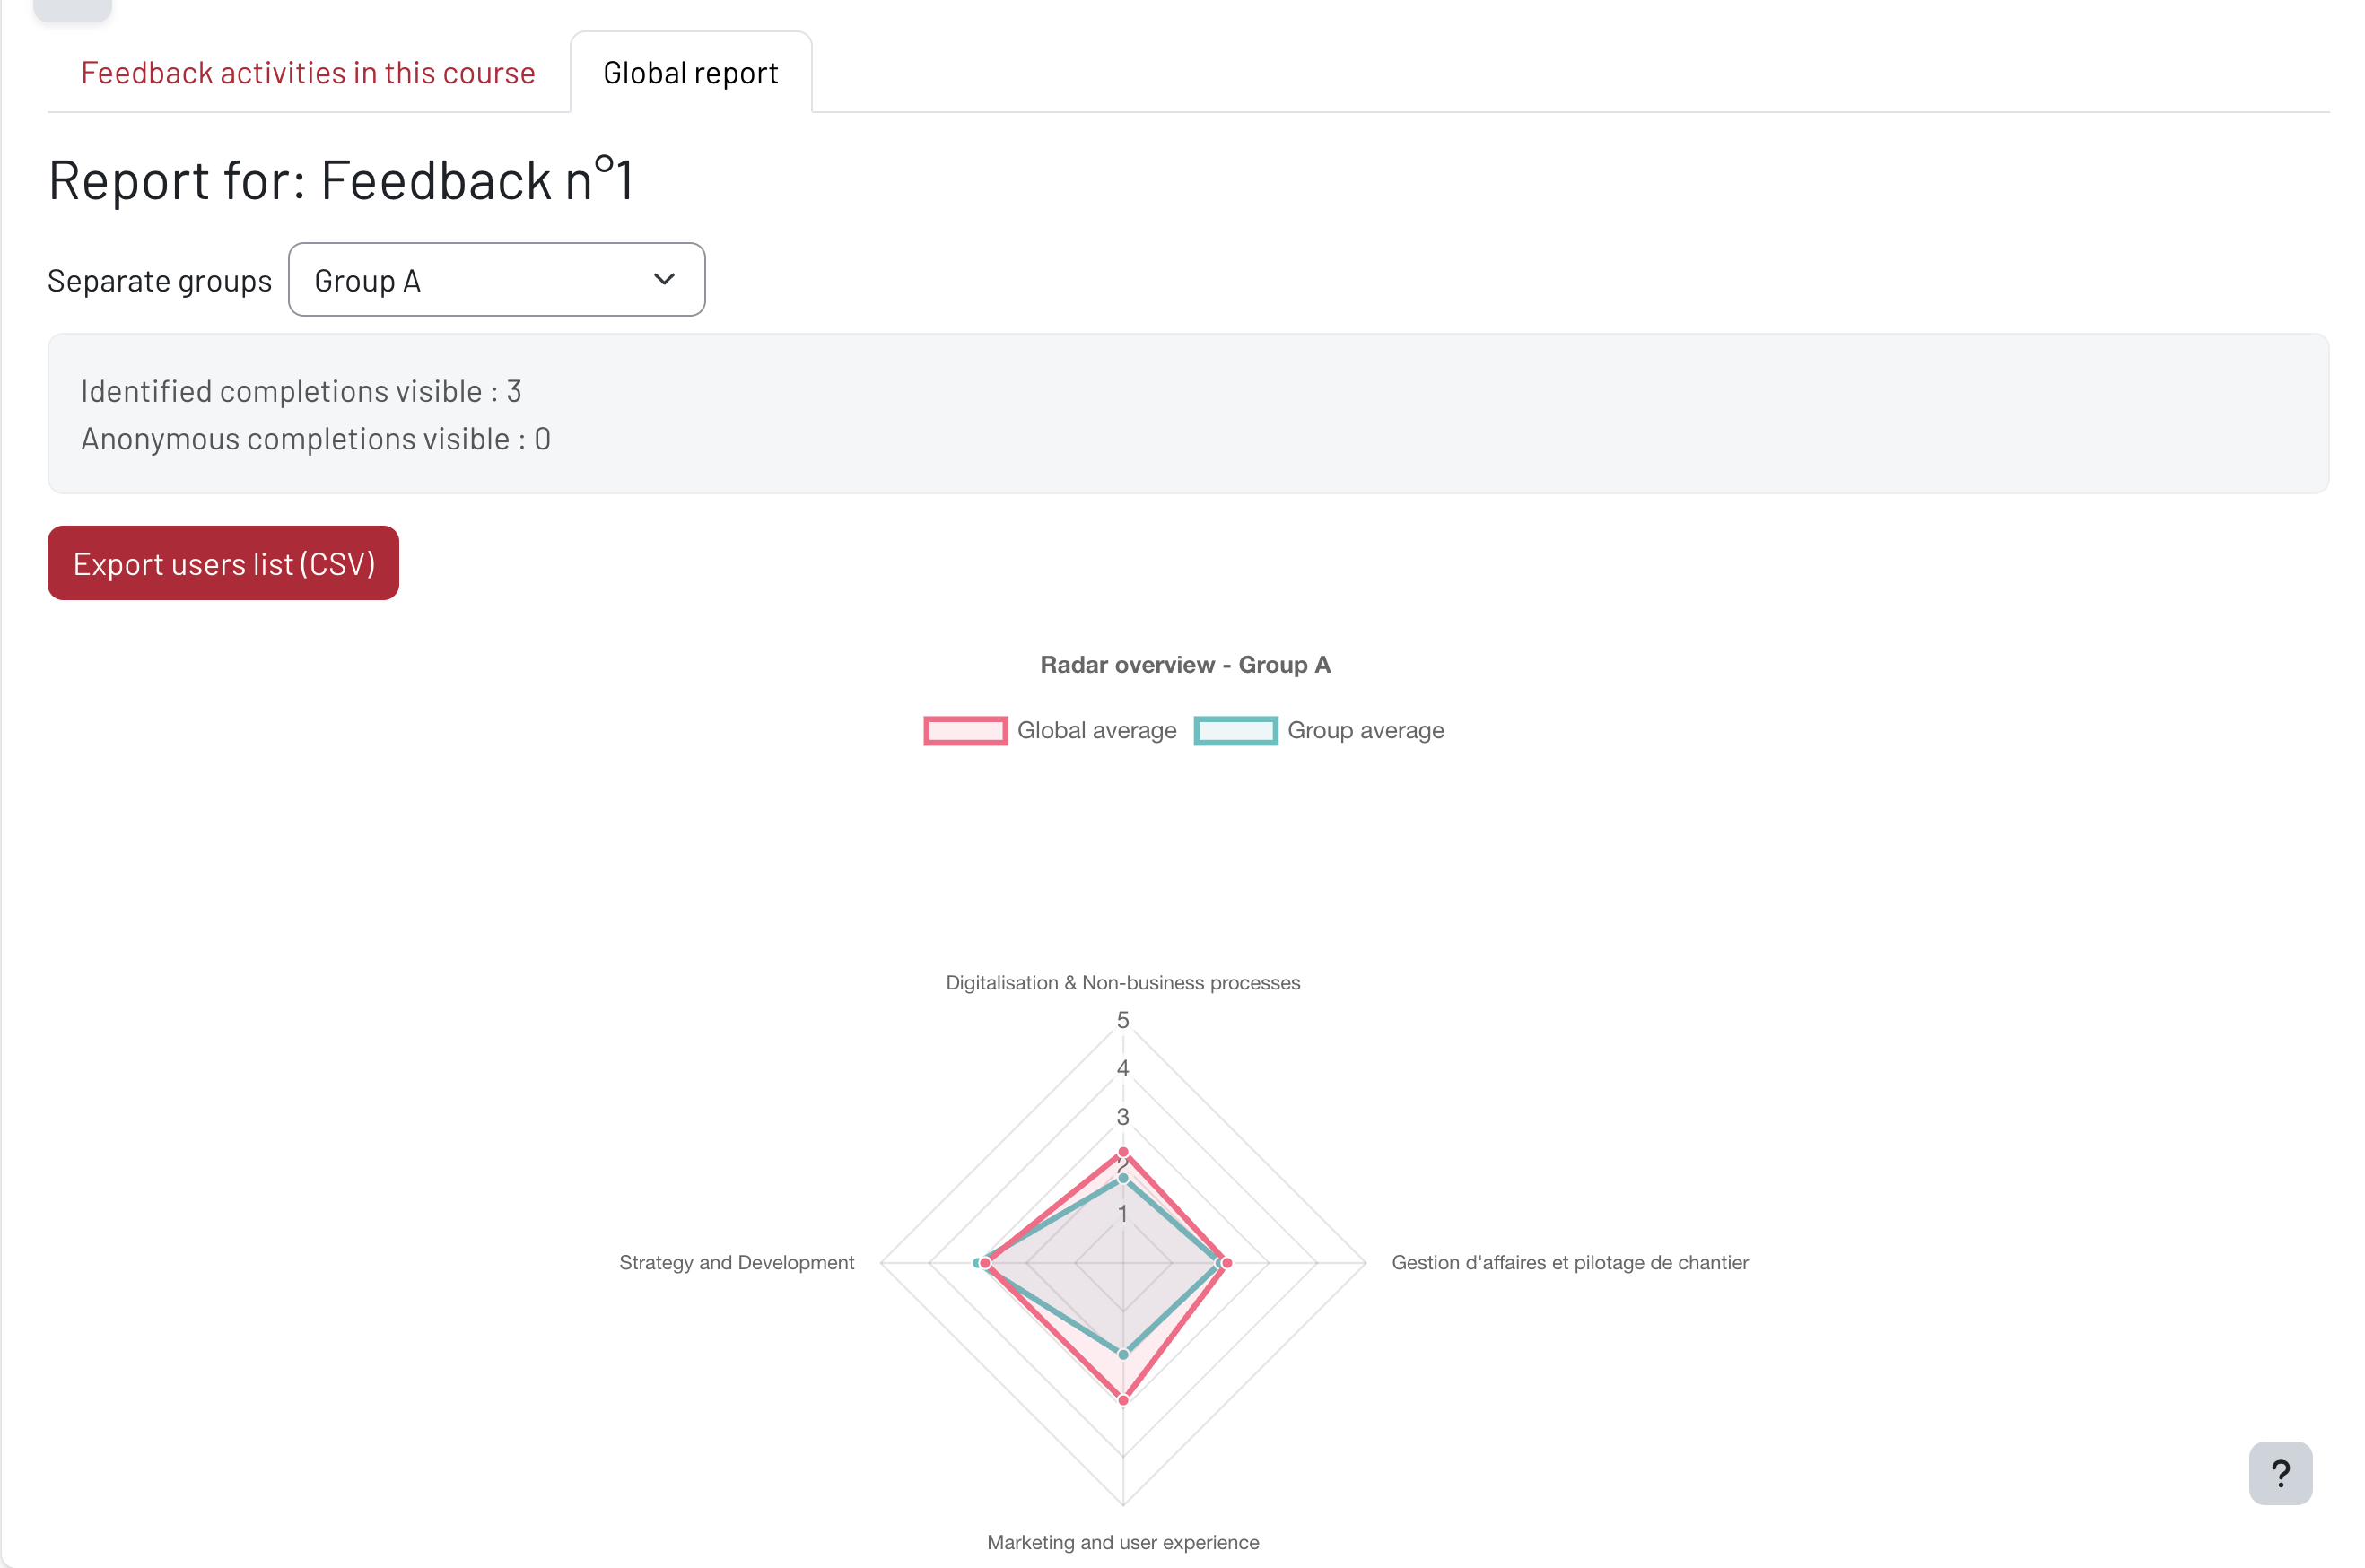
For teachers and course designers, Feedback Radar provides an instant visual overview of questionnaire results — without manually sorting through individual responses. See at a glance which thematic areas score highest or lowest, compare a specific learner against their group and the overall course average, all in a single chart.
For training organisations and institutions, the plugin generates export-ready reports with average scores per category, broken down by learner, group or full course. Data is reliable because neutral responses ("N/A", "I don't know") can be excluded from calculations.
What types of Feedback questions are supported by the radar chart?
Only rated multichoice — single answer questions with numerical values assigned to each option. Other question types (free text, yes/no, etc.) are not included in average calculations but remain visible in the standard Feedback report.
Can I filter the results by learner group?
Yes. If groups are configured in the course, a filter lets you display results for a specific group — both in the summary table and in the radar chart.
How does Feedback Radar handle anonymous responses?
Anonymous responses are included in the global statistics (overall radar chart and summary table) but excluded from individual learner reports, in line with Moodle's own anonymity settings for the Feedback activity.
Who provides support?
Support is provided by Pimenko, a certified Moodle Partner based in Lyon, France. Requests are handled via our issue tracker within 5 business days.