Andreas Walter
Developer

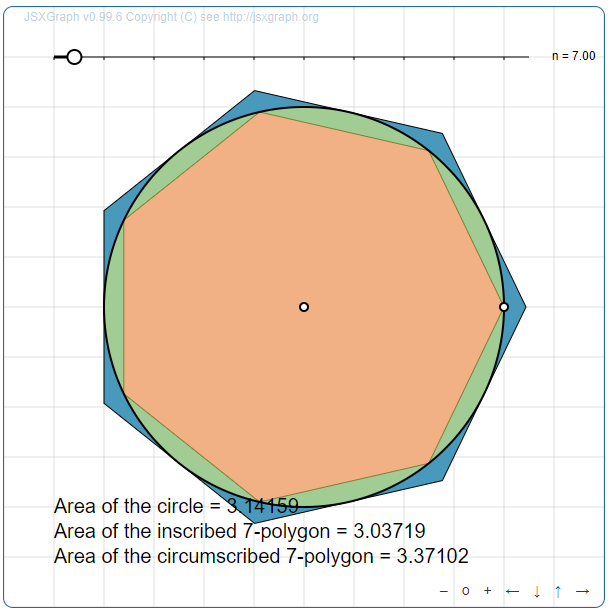
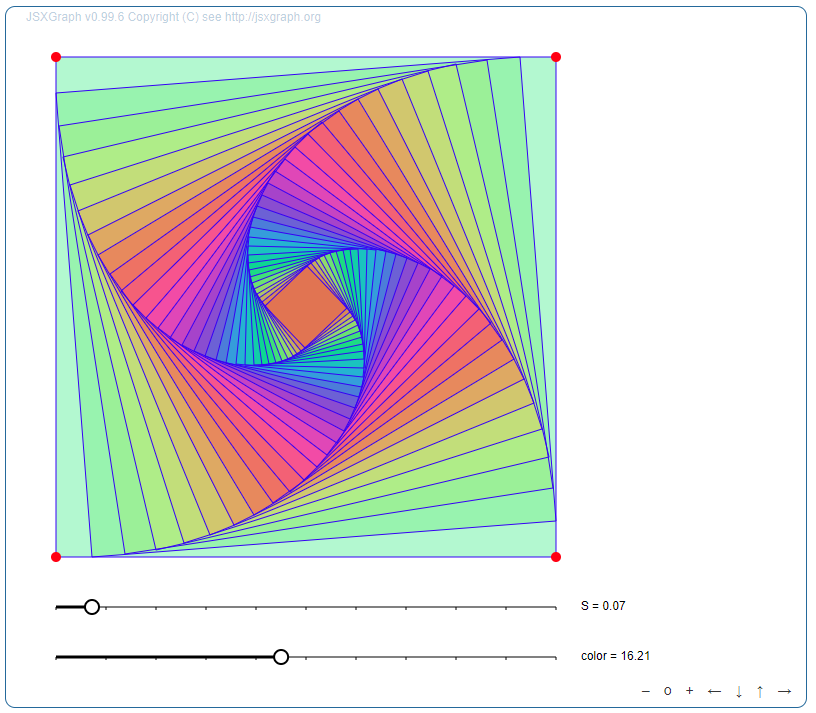
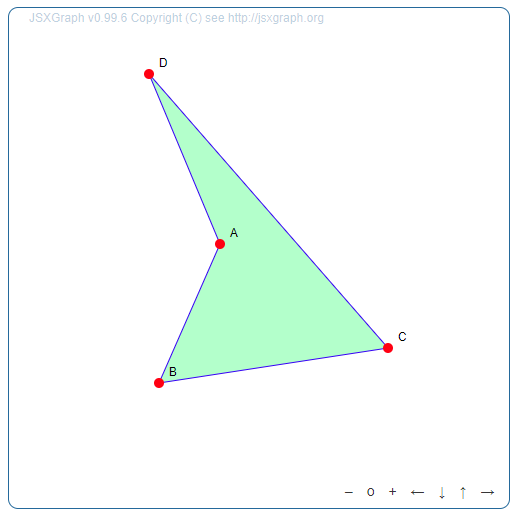
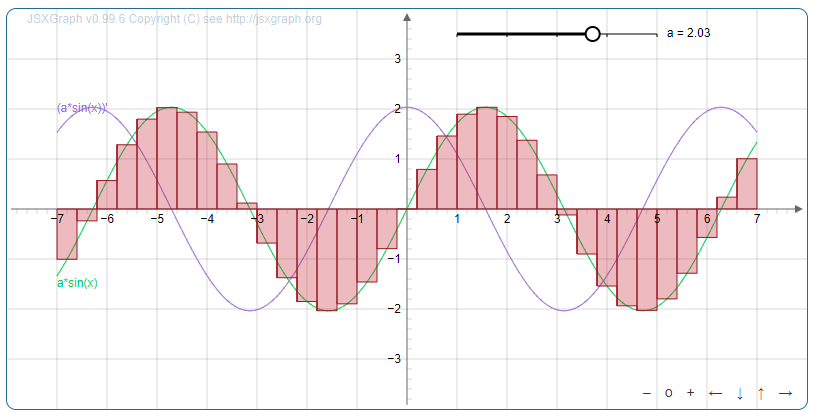
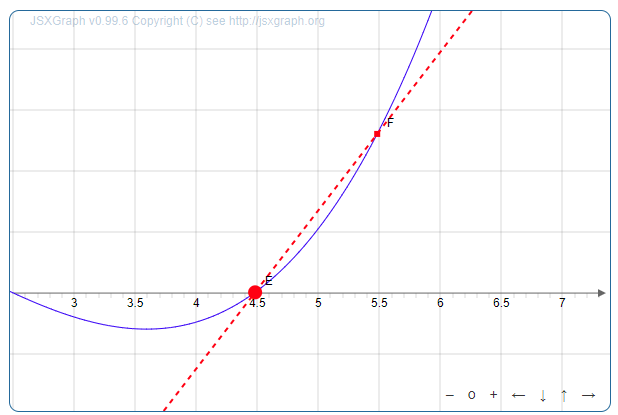

JSXGraph is a cross-browser JavaScript library for interactive geometry, function plotting, charting, and data visualization in the web browser. JSXGraph is implemented in pure JavaScript and does not rely on any other library. Special care has been taken to optimize the performance.
Have a look at jsxgraph.org.
This is a plugin for Moodle to enable function plotting and dynamic geometry constructions with JSXGraph within a Moodle platform. Using the JSXGraph filter makes it a lot easier to embed JSXGraph constructions into Moodle online documents, e.g. in contents like page, quiz, link,...
In a Moodle course you can add a board to different types of content, i.e.: Page, Link, Quiz, ...
At the position the construction should appear, create a construction by:
<jsxgraph> tag with all required parameters<div> that contains a JSXGraph board needs a unique ID on the page. You can specify this ID within the tag (see here). Otherwise an ID is generated automatically. Reference it within the JavaScript using the constant BOARDID.(*) Important notice:
Please note that some Moodle editors remove the <jsxgraph> tag when saving. As a result, the construction may not be displayed correctly or at all. You should therefore always use the "Plain text editor".
Example:
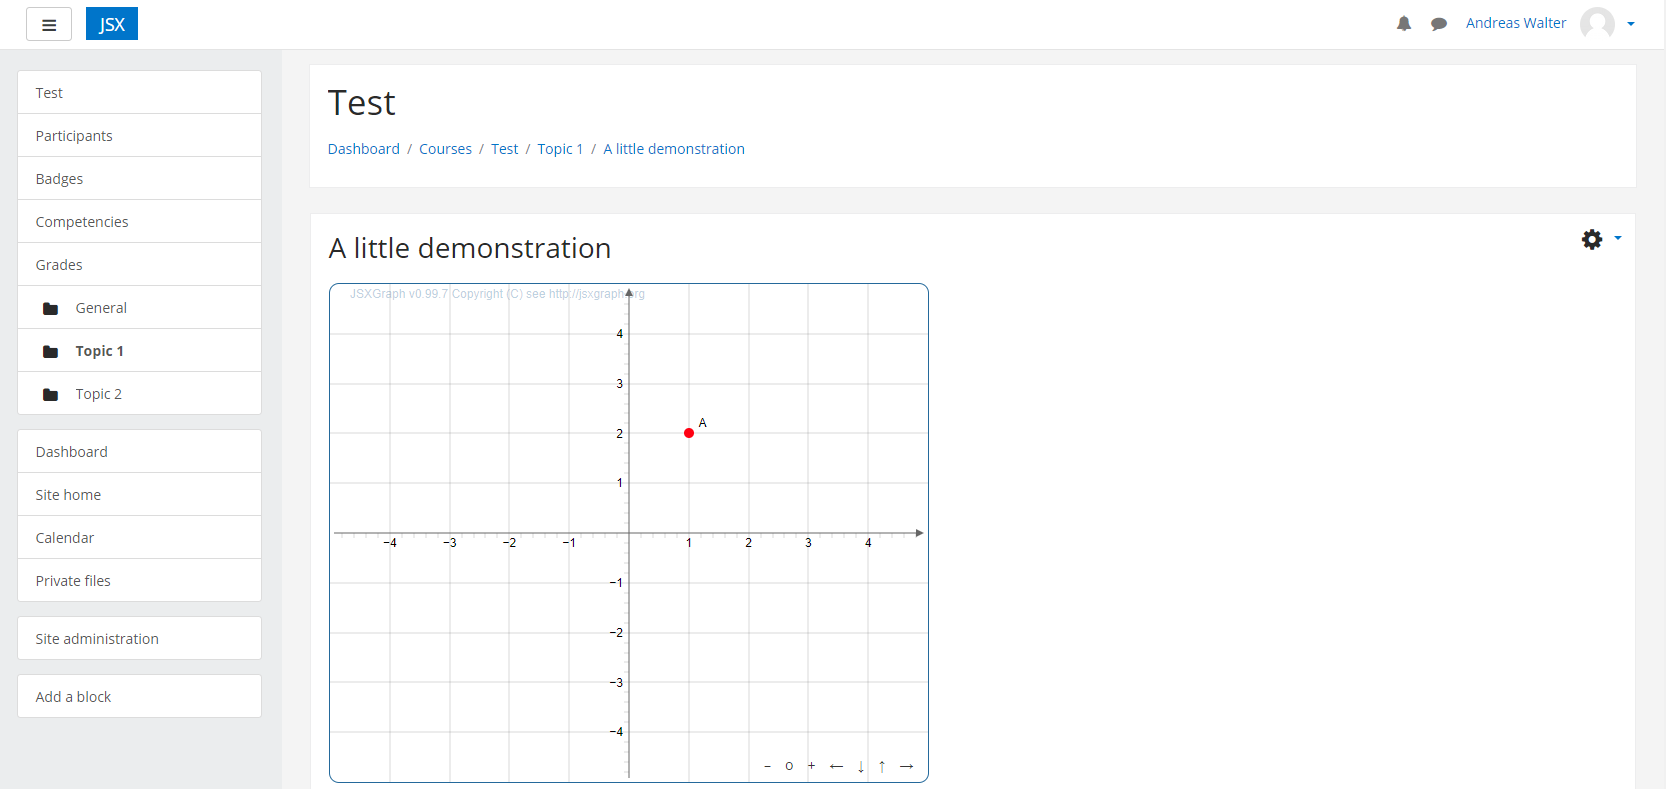
<jsxgraph width="600" height="500">
    var brd = JXG.JSXGraph.initBoard(BOARDID, {boundingbox:[-5,5,5,-5], axis:true});
    var p = brd.create('point', [1,2]);
</jsxgraph>
For tag attributes and more settings have a look at https://github.com/jsxgraph/moodle-jsxgraph-plugin/blob/master/README.md.
For using JSXGraph within a formulas question see here: https://github.com/jsxgraph/moodleformulas_jsxgraph/blob/master/README.md.
Get many examples for constructions at https://jsxgraph.org/share. There you can export them to the JSXGraph Moodle filter format.
Have a look to this video
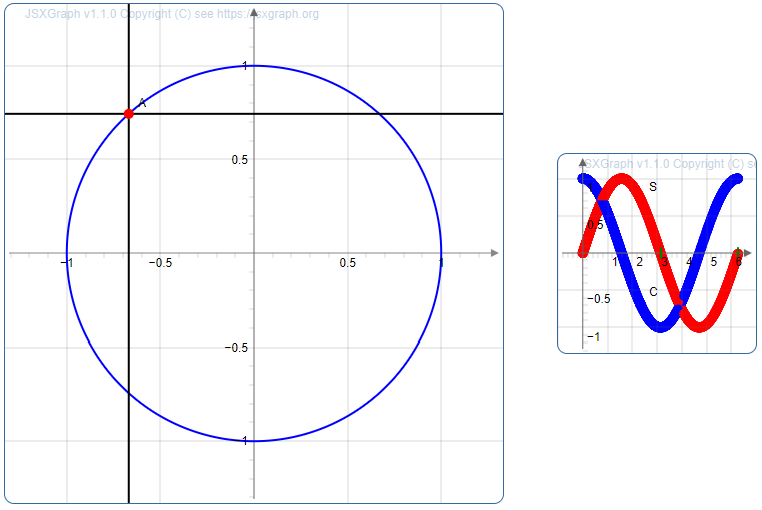
It is possible to replace a jsxgraph tag with more than one board. To do this, enter a number in the tag attribute numberOfBoards. This does the following:
BOARDID, the unique ids can now be found in BOARDID0, BOARDID1, BOARDID2, ...width, height, title and description can contain several values. These are separated by commas. The first value applies to the first board, the second value to the second, etc. If not enough values are given (especially only one), the first value is used for the other boards.Example:
<jsxgraph width="500,200" height="500,200" numberOfBoards="2">
   var board = JXG.JSXGraph.initBoard(BOARDID0, {boundingbox: [-1.33, 1.33, 1.33, -1.33], axis: true, showNavigation:false});
   var board2 = JXG.JSXGraph.initBoard(BOARDID1, {boundingbox: [-1, 1.33, 7, -1.33], showNavigation:false});

   board.suspendUpdate();
   var b1c1 = board.create('circle', [[0,0], [1,0]], {fixed:true});
   var b1p1 = board.create('point', [2, 0], {slideObject: b1c1});
   var perp = board.create('perpendicular', [board.defaultAxes.x,b1p1],[{strokeColor: '#ff0000', visible: true}, {visible: false}]);
   var perp2 = board.create('perpendicular',[board.defaultAxes.y,b1p1],[{strokeColor: '#0000ff', visible: true}, {visible: false}]);
   board.unsuspendUpdate();

   board2.suspendUpdate();
   var xax2 = board2.create('axis', [[0,0], [1,0]]);
   board2.create('axis', [[0,0], [0,1]]);
   board2.create('ticks', [xax2, [Math.PI, 2*Math.PI]], {strokeColor: 'green', strokeWidth: 2});

   // sine:
   var b2p1 = board2.create('point', [
                function(){ return JXG.Math.Geometry.rad([1,0],[0,0],b1p1); },
                function() { return b1p1.Y() }],
                {fixed: true, trace: true, color: '#ff0000', name: 'S'});
   // cosine:
   var b2p2 = board2.create('point', [
                function(){ return JXG.Math.Geometry.rad([1,0],[0,0],b1p1); },
                function() { return b1p1.X() }],
                {fixed: true, trace: true, color: '#0000ff', name: 'C'});
   // Dependencies (only necessary if b2p1 or b2p2 is deleted)
   b1p1.addChild(b2p1);
   b1p1.addChild(b2p2);
   board2.unsuspendUpdate();

   board.addChild(board2);
</jsxgraph>

