
JSXGraph
Maintained by
Andreas Walter
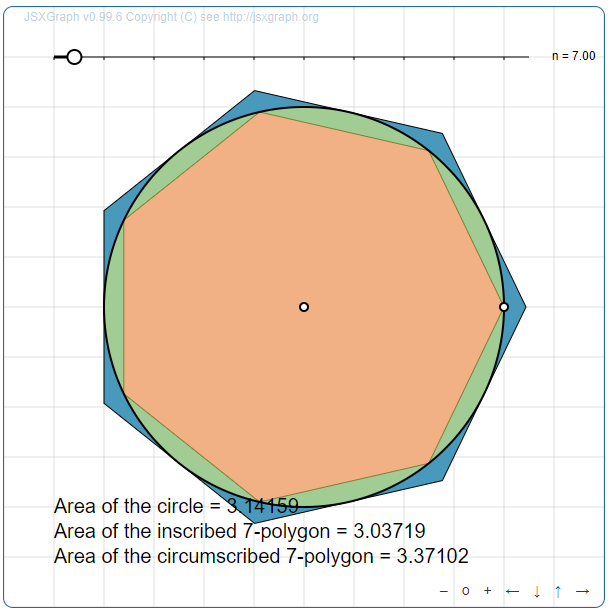
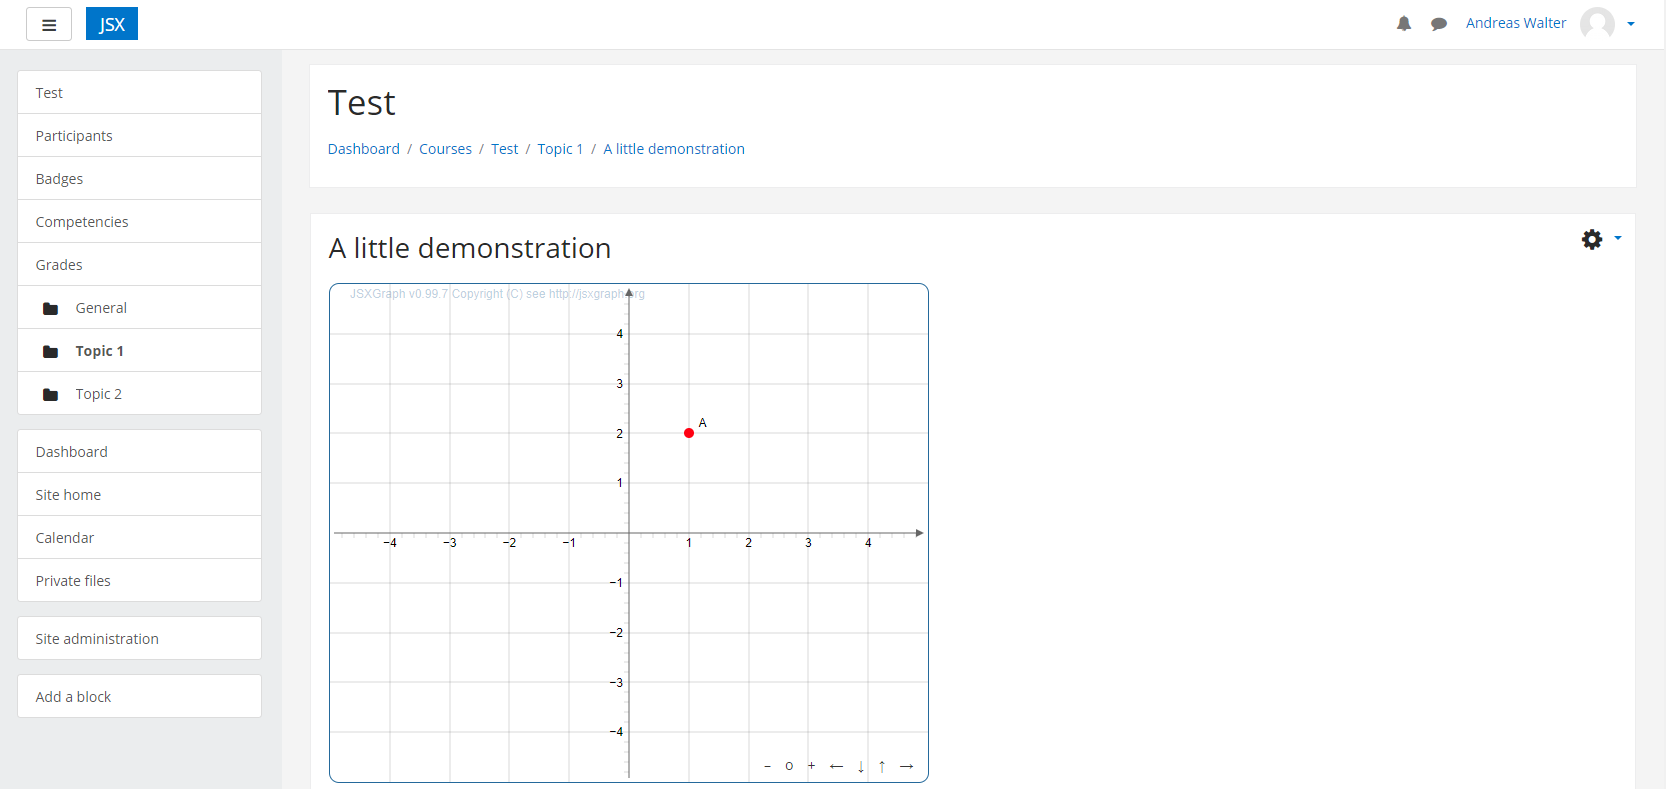
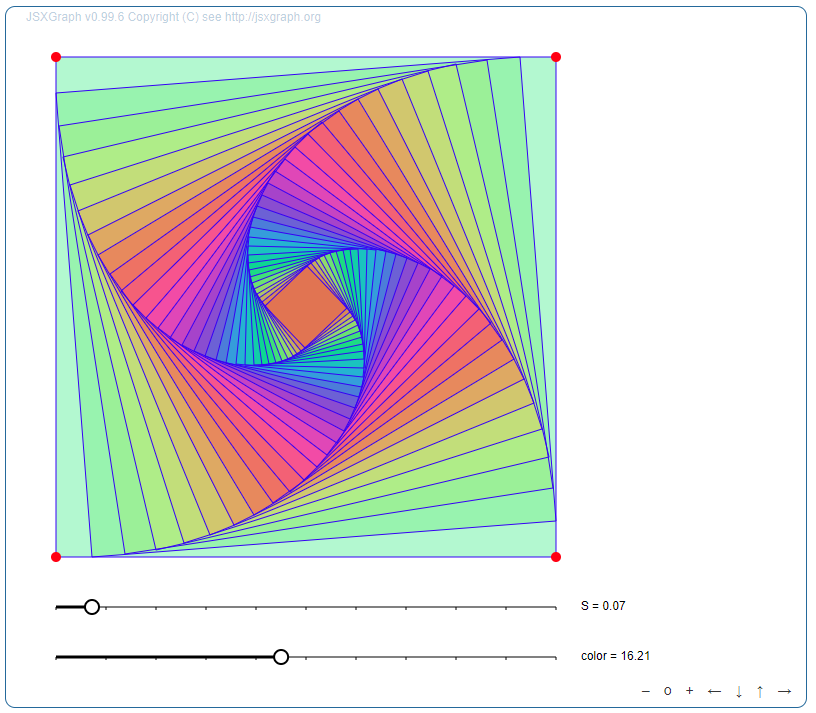
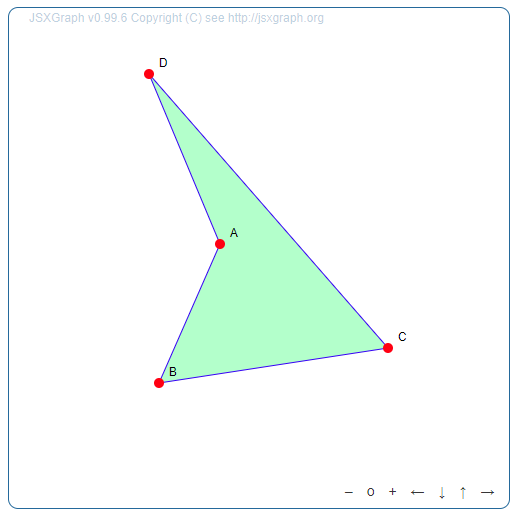
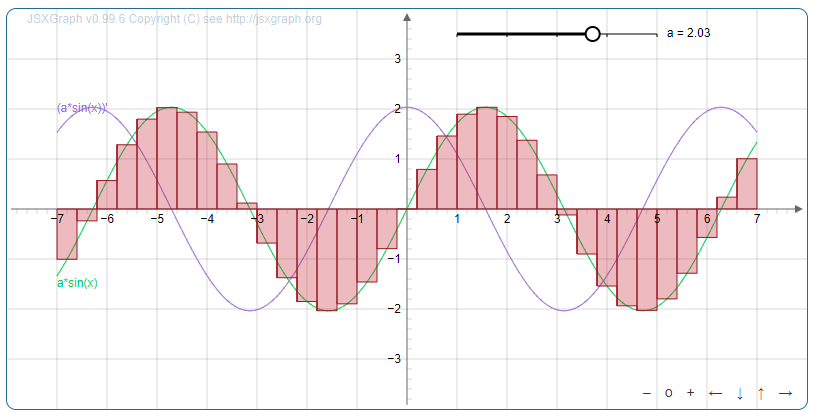
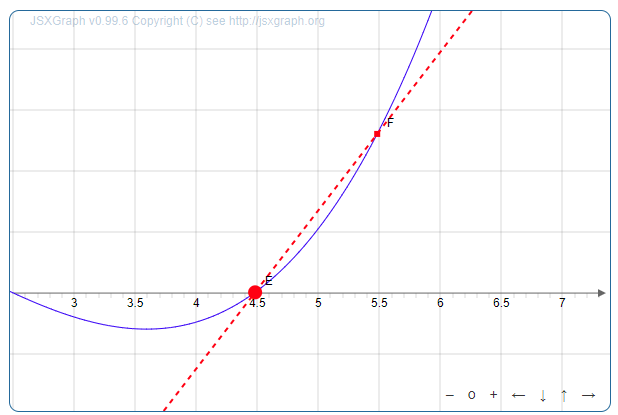
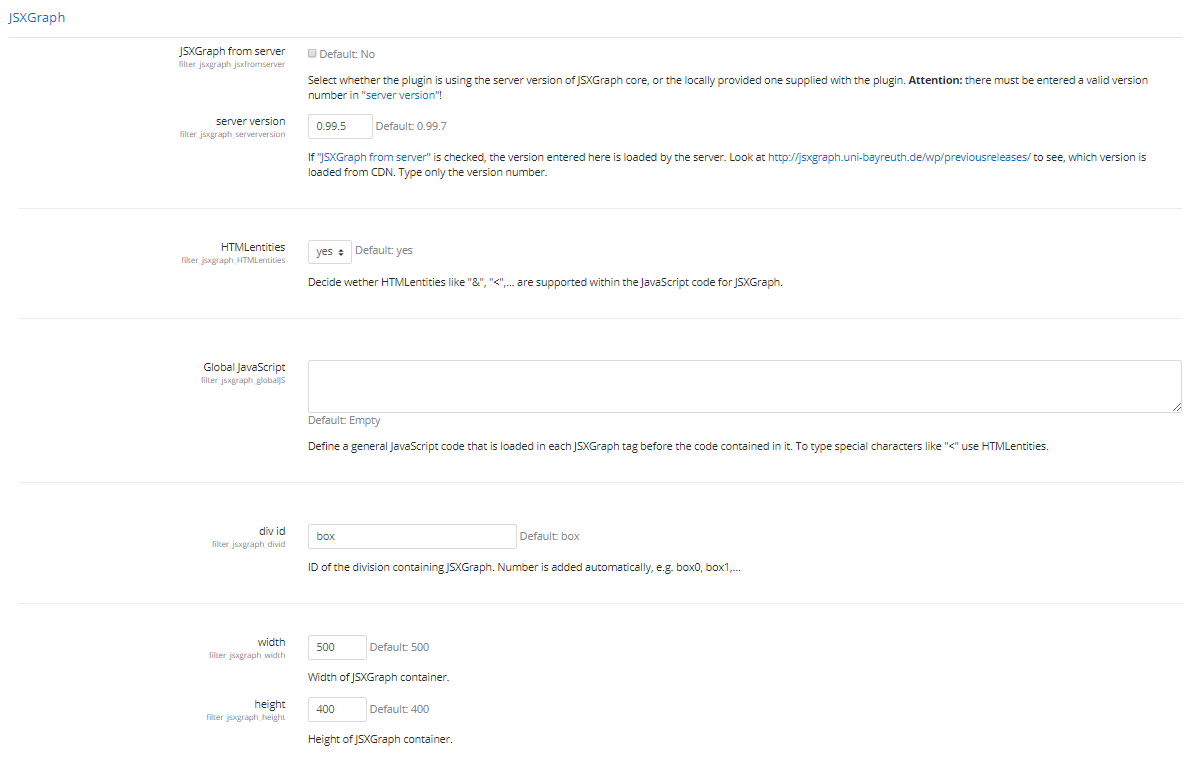
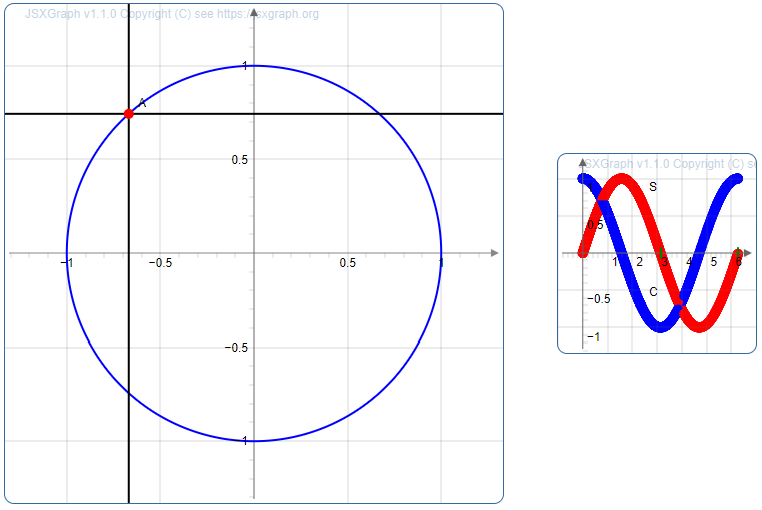
JSXGraph is a cross-browser JavaScript library for interactive geometry, function plotting, charting, and data visualization in the web browser. This is a plugin for Moodle to enable function plotting and dynamic geometry constructions with JSXGraph within a Moodle platform. Using the JSXGraph filter makes it a lot easier to embed JSXGraph constructions into Moodle online documents, e.g. in contents like page, quiz, link,...
Translations
These translations are contributed by the Moodle community. Contribute a translation.
Strings translated by language
Total strings in this plugin: 134
| Percentage of language strings translated | |
|---|---|
| Czech [cs] | 100 |
| English [en] | 100 |
| Polish [pl] | 100 |
| Spanish - Mexico [es_mx] | 100 |
| Greek [el] | 40 |
| Portuguese [pt] | 32 |
| Romanian [ro] | 28 |
| Arabic [ar] | 12 |
| Swedish [sv] | 8 |
| Turkish [tr] | 8 |
| Croatian [hr] | 4 |
| Sanskrit [sa] | 4 |