
JSXGraph
Maintained by
Andreas Walter
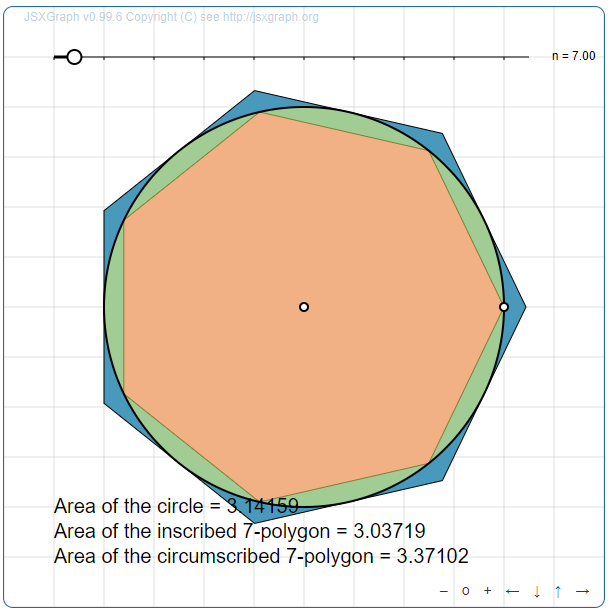
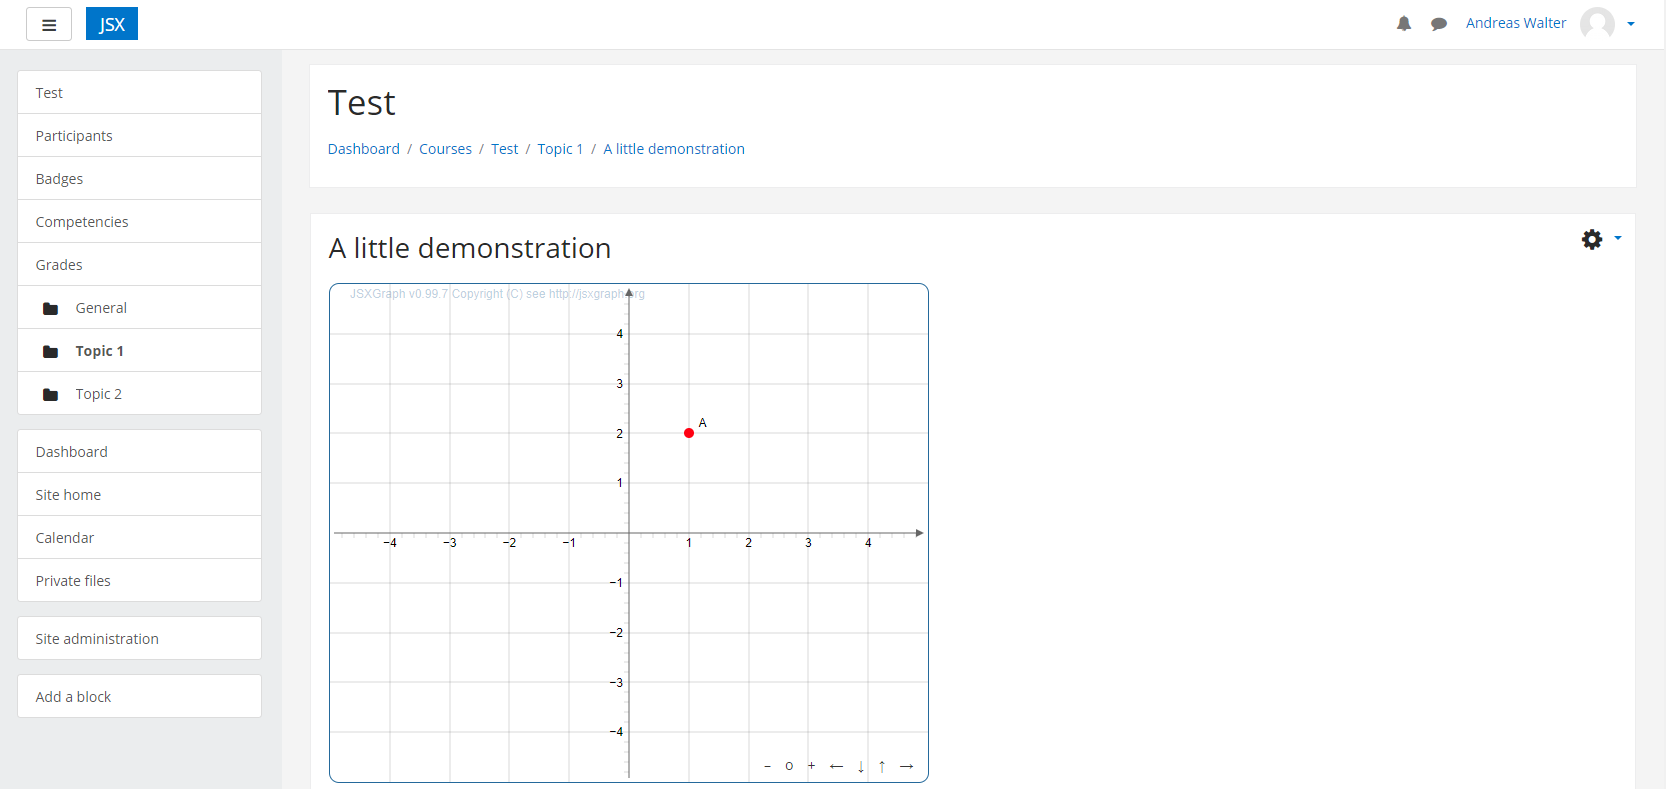
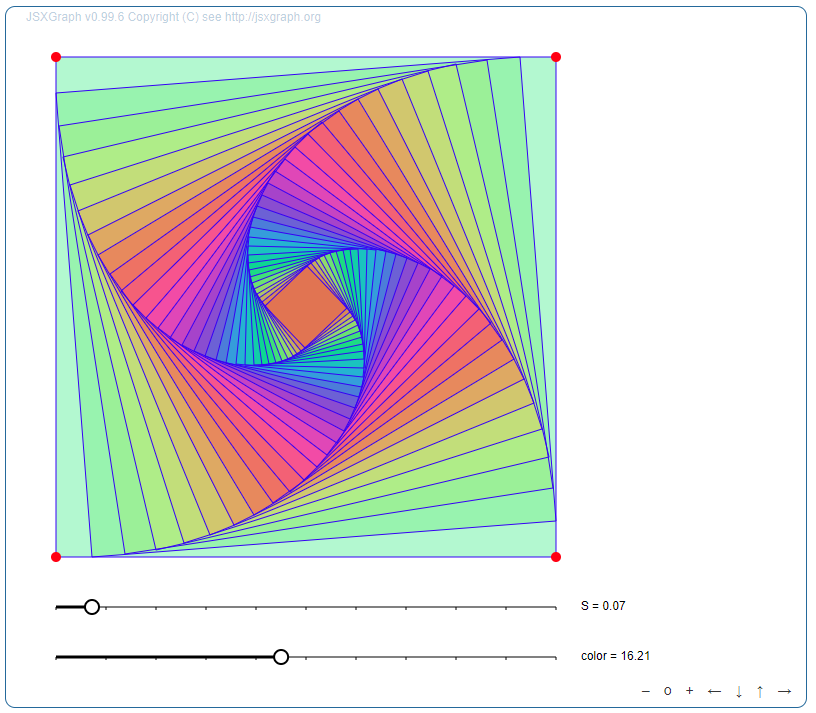
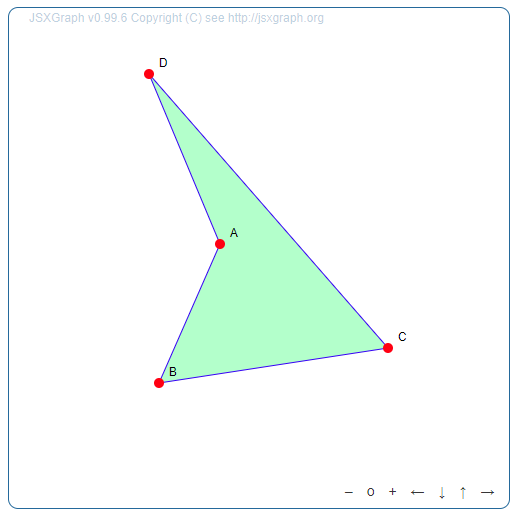
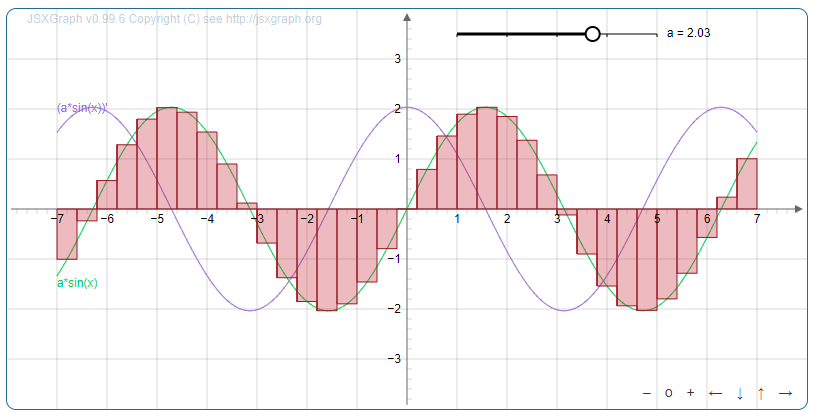
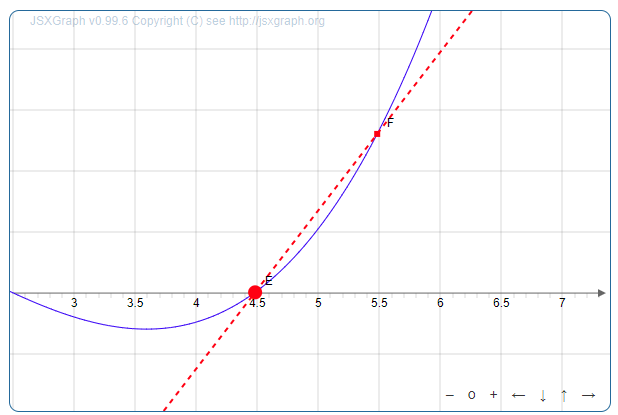
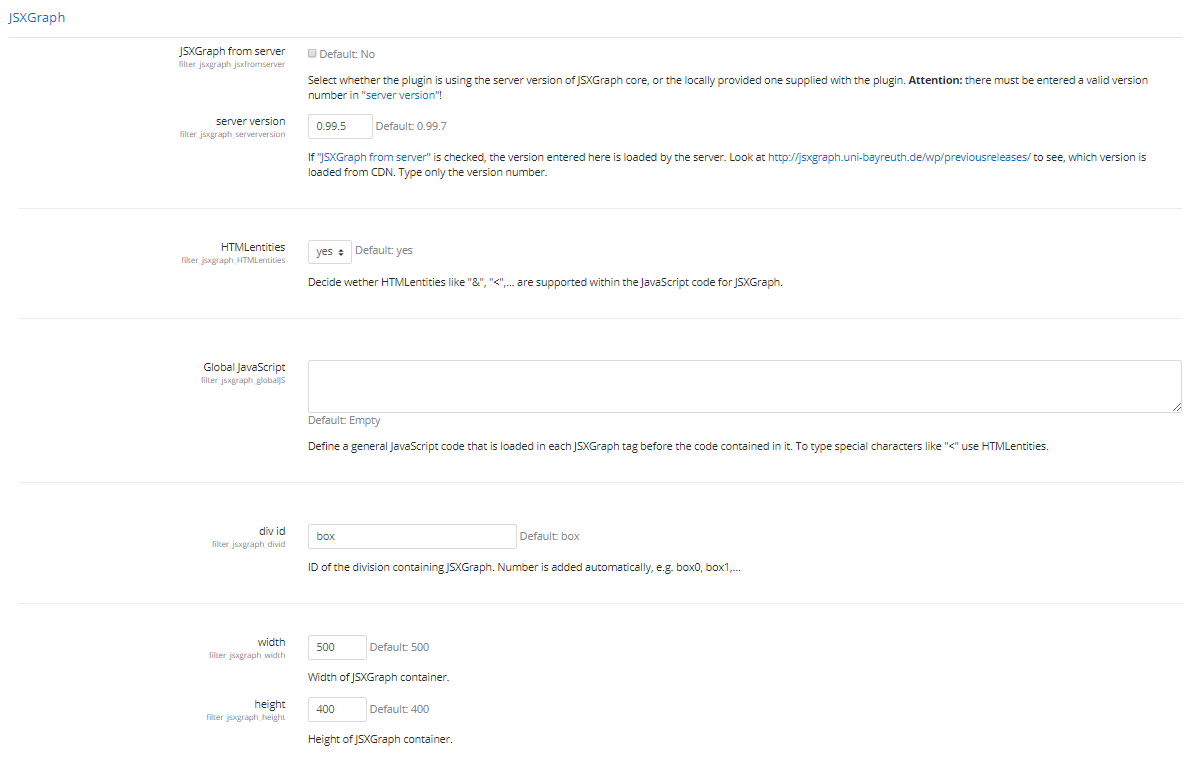
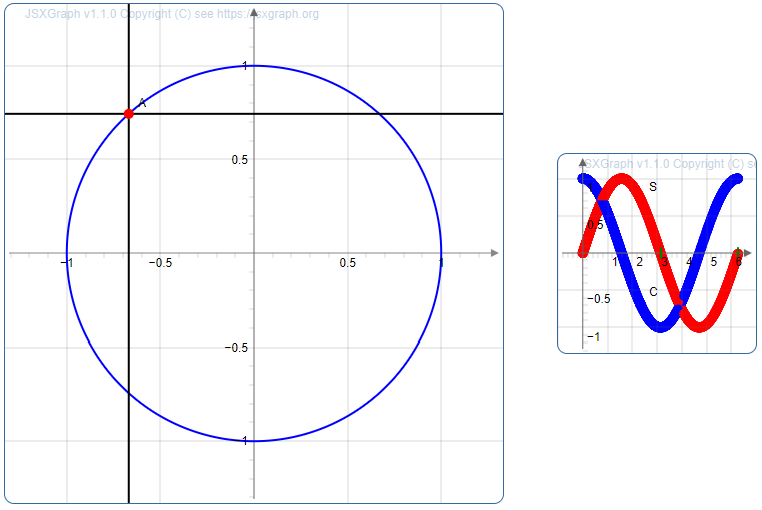
JSXGraph is a cross-browser JavaScript library for interactive geometry, function plotting, charting, and data visualization in the web browser. This is a plugin for Moodle to enable function plotting and dynamic geometry constructions with JSXGraph within a Moodle platform. Using the JSXGraph filter makes it a lot easier to embed JSXGraph constructions into Moodle online documents, e.g. in contents like page, quiz, link,...
Comments
Comments are no longer open for new posts. Existing comments remain available to read.
Our bug tracker is right here: https://github.com/jsxgraph/moodle-filter_jsxgraph/issues. Would you please open a new issue with your problem and attach some minimal example as Moodle-XML file? Then we can definitely help you!
Andreas
I tested the moodle filter in my test environment (version 3.11.6) before the release and found no errors. By the way, the core functionality of the filter has not changed in this release. In my test environment, all boards are displayed correctly in activities - also in formulas questions.
If you find any errors, please check your installation again. If these continue to occur, please report them using the following link as the comments in the Plugins directory are NOT intended for this: https://github.com/jsxgraph/moodle-filter_jsxgraph/issues
The current release only supports Moodle versions 2.9 to 3.11. You can also read about this under "versions". A version of the filter for Moodle 4.0 is planned, but will take a few more weeks. I ask for patience here.
Best regards,
Andrew Walter
Does The version 1.4.3. Work well in Moodle version 3.11.6 and 4.0?
I have tried but the question didn't show the graphical. Will it be solved in a future?
Thanks you
I see you have already opened a case in our bug tracker at https://github.com/jsxgraph/moodle-filter_jsxgraph/issues. I would have suggested that too, since we can discuss things better there and exchange files. I will answer there. For others: This specific issue can be find under https://github.com/jsxgraph/moodle-filter_jsxgraph/issues/25.
Andreas
We then tried to back up the course and restore it new, that too failed to display the graphs. We then tried to backup and restore just the quiz content, that too failed.
The only approach that seems to work is to create a new quiz and pull in the questions from the question bank. This, however, is a rather long winded way of having to do the job.
But your problem seems to be a Moodle/cache bug: https://moodle.org/mod/forum/discuss.php?d=398091.